Asian Paint
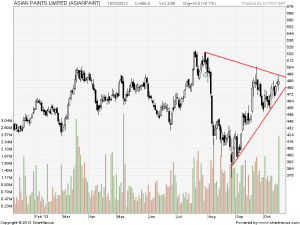
Asian Paint is trading in triangle pattern with resistance at 495 and support at 475. Stock has formed a DOJI pattern with volumes signalling an explosive move is round the corner.
Buy above 487 Tgt 492,495 and 500 SL 484
Sell below 483 Tgt 477,472 and 469 SL 485
Zee Limited
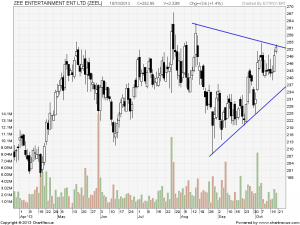
Any close above 254 will give target of 267 and 288 in short term.
Buy above 254 Tgt 256,258 and 267 SL 252
Sell below 250 Tgt 246,241 and 238 SL 252
Axis Bank
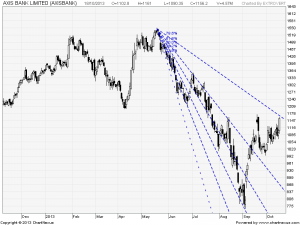
Axis bank near its 100 DMA and Fibo resistance.
Buy above 1161 Tgt 1170,1181 and 1200 SL 1155
Sell below 1150 Tgt 1142,1135 and 1120 SL 1155
Stock Performance Sheet for the Month of September is Updated @http://tradingsystemperformance.blogspot.in/ Net Profit for the month of Sep is 1.82 Lakh and Oct Month 1.62 Lakh
Stock Performance Positional sheet for Sep Month is updated on http://positionalcallsperformance.blogspot.com/ Net Profit for Sep Month 2.35 Lakhs , Oct Month 1.56 Lakh
- All prices relate to the NSE Spot
- Calls are based on the previous trading day’s price activity.
- The call is valid for the next trading session only unless otherwise mentioned.
- Stop-loss levels are given so that there is a level below/above, which the market will tell us that the call has gone wrong. Stop-loss is an essential risk control mechanism; it should always be there.
- Book, at least, part profits when the prices reach their targets; if you continue to hold on to positions then use trailing stops to lock in your profits.


