Sensex is 300 points from its all time high and Nifty trading at 3 year high, Lets analyze how to trade Nifty in coming week.
Nifty Daily Chart
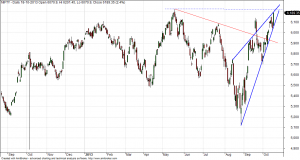
Nifty Daily chart is forming a rising wedge formation, Pattern gets invalidated on close above 6207. Any close above 6229 will take nifty to next supply zone of 6285-90. Lot of optimism is on Media Nifty crossing all time high on Diwali, Do not be carried away by the exuberance created by Media and do not try to be over leverage, I would advise caution at higher levels.
Nifty Gaps
For Nifty traders who follow gap trading there are 5 trade gaps in the range of 5300-6000 and all other gaps got filled.
- 5285-5303
- 5448-5553
- 5680-5700
- 5780-5802
- 6046-6021
- 6070-6046
Fibonacci technique
Fibonacci fan
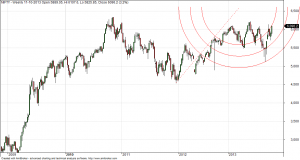
Nifty Fibonacci fan are wonderful tool to find the top and bottom in short term.Nifty at resistance of Fibo Fan and support comes at 6000
Nifty Weekly Chart
Trading Monthly charts
Nifty monthly chart is trading above its 2 month high, next strong resistance comes at 6229.
Nifty Trading Levels
Nifty Trend Deciding Level:6207
Nifty Resistance:6255,6337,6385 and 6467
Nifty Support:6141,6077 and 6010
Levels mentioned are Nifty Spot
Stock Performance Intraday sheet for Sep Month is updated on http://tradingsystemperformance.blogspot.com/
Stock Performance Positional sheet for Sep Month is updated on http://positionalcallsperformance.blogspot.com/
Let me go by Disclaimer these are my personal views and trade taken on these observation should be traded with strict Sl
Want to see post in your Inbox,Register by adding your email id in Post in your Inbox section
Follow on Facebook during Market Hours: https://www.facebook.com/pages/Brameshs-Tech/140117182685863


