Indian market rejoiced the appointment of the new RBI governor and his optimistic road plan, as Nifty rallied almost 372 points from Sep low of 5316 and Bank Nifty 1384 points and Rupee rallied more than 5%.
Also Next weak American government will decide to strike on SYRIA as there will be a final VOTE in the parliament for the go ahead for the attack. So keep a watch on the event which can lead to rally in Crude which will be negative for Indian Markets.
Indian markets will be closed on Monday on the auspicious eve of Ganesh Chaturthi
Last week we gave Trend Deciding level as 5508 Nifty Nifty achieved 2 target on downside and 2 target missed by 20 points 
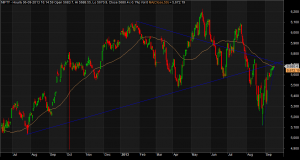
Nifty Hourly Chart
Nifty Hourly charts as shown above is facing both upward rising trend line and 50 DMA.Close above 5686 on hourly basis can lead to further upside else we are in for short term pullback.
Nifty Gaps
For Nifty traders who follow gap trading there are 1 trade gaps in the range of 5400-6000 and all other gaps got filled.
- 5742-5716
- 5548-5553
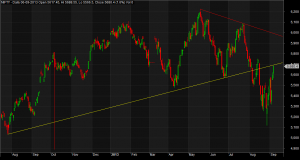
Nifty Daily Chart
Nifty daily chart after rallying 372 is now facing resistance at its 1 year old trendline as shown in below chart. Any close above it will take nifty towards its 200 DMA. September has been Mostly Bullish month for Indian market Sep 2010 Nifty rallied 9% Sep 2011 Nifty was down 1.2% Sep 2012 up by 8% and Sep 13 till date is up 3.8%.
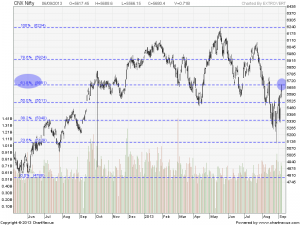
Fibonacci technique
As per of Fibo Retracement theory Nifty has taken resistance at 61.8% retracement,Unable to close above it on weekly basis and closing below 5556 will lead to gap filling.
Fibonacci fan
Nifty Fibonacci fan are wonderful tool to find the top and bottom in short term.The above chart is self explanatory
As per Nifty Chopad levels close above 5686 will only be a booster for Bulls. Last week Nifty Chopad level of 5556/5426 played the trick as we were able to capture the top and participate corrective downmove.
Nifty Weekly Chart
Trading Monthly charts
Monthly charts have given a breakdown and is now approaching the rising trendline. WIll this again be a failed breakdown ?
Nifty Trading Levels
Nifty Trend Deciding Level:5686
Nifty Resistance:5735,5784,5816 and 5865
Nifty Support:5605,5556,5508 and 5448
Levels mentioned are Nifty Spot
Stock Performance Intraday sheet for Sep Month is updated on http://tradingsystemperformance.blogspot.com/
Stock Performance Positional sheet for Sep Month is updated on http://positionalcallsperformance.blogspot.com/
Let me go by Disclaimer these are my personal views and trade taken on these observation should be traded with strict Sl
Want to see post in your Inbox,Register by adding your email id in Post in your Inbox section
Follow on Facebook during Market Hours: https://www.facebook.com/pages/Brameshs-Tech/140117182685863


