SBI
SBI is seeing a range contraction on daily charts and weekly charts have been falling from past 12 weeks. SBI is showing range contraction on weekly chart and explosive move is round the corner. Positional traders should go long above 1686 for Tgt of 1741,1830. Positional shorts should be entered below 1597 for short term target of 1542 and 1453
Buy above 1678 Tgt 1705,1729,1741 and 1772 SL 1664
Sell below 1650 Tgt 1637,1610,1597 and 1569 SL 1664
J P Power
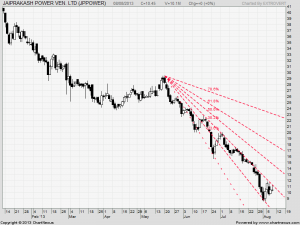
JP Power has been under bear hammering as i just 3 months stock lost its 1/3 market capital. JP has formed double bottom at 8.55 and showing signs of revival. Stock is facing tough resistance at its Fibo Fan as shown in above chart. Any close above 11.25 can propel the stock back to 13-14 range.
Buy above 10.7 Tgt 11.05,11.65 and 12 SL 10.45
Sell below 10.25 TGt 10,9.6 and 9 SL 10.45
DLF
DLF has been trading is perfect downtrending channel, stock has been rallying from past 2 trading sessions but unable to cross its swing high of 142. Any close above 144 gives short term target of 149 and 156 in short term.
Buy above 140 TGt 141.5,144,149 SL 136.3
Sell below 136 Tgt 133,131,129 and 127 SL 137
Stock Performance Sheet for the Month of June is Updated @http://tradingsystemperformance.blogspot.in/ Net Profit for the month of Aug is 1.21 Lakh
- All prices relate to the NSE Spot
- Calls are based on the previous trading day’s price activity.
- The call is valid for the next trading session only unless otherwise mentioned.
- Stop-loss levels are given so that there is a level below/above, which the market will tell us that the call has gone wrong. Stop-loss is an essential risk control mechanism; it should always be there.
- Book, at least, part profits when the prices reach their targets; if you continue to hold on to positions then use trailing stops to lock in your profits.
We do discussion in Live market to update Nifty/Stock levels If you are interested you can LIKE the page to get Real Time Updates.


