IDFC
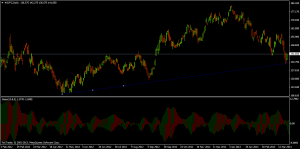
 IDFC has taken support at its medium term trendline and has given a strong pullback in a weak market.As per Gator oscillator, Green Bar is formed which signify Alligator has woken up and is ready to eat, Stock will continue its pullback once it closes above 145.5
Buy above 144.2 Tgt 145.2,147 and 148.4 SL 143.1
Sell below 141 Tgt 140.1,139 and 137.1 SL 143
SBIN
SBI share is near crucial trendline support of 2076 and Budget day low of 2051. Stock has closed below its 200 DMA on weekly basis which is bearish for stock. SBI is also forming Head and Shoulder pattern neckline at 2051, break below it pattern gets active and target comes around 1800 levels.
Buy above 2097 Tgt 2113,2136 and 2150 SL 2084
Sell below 2075 Tgt 2063,2051 and 2041 SL 2084
DLF
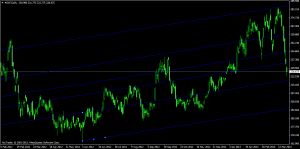
DLF has been falling like 9 Pins from the high of 281 from 227 in matter of 5 trading sessions. As of now stock is not forming any bottoming out formation. As per Fibonacci channels as drawn in above chart stock can form a potential bottom at 220 odd levels.
Buy above 233.4 Tgt 235,238 and 241 SL 232
Sell below 229 Tgt 227.5,225.5 and 223 SL 231
- All prices relate to the NSE Spot
- Calls are based on the previous trading day’s price activity.
- The call is valid for the next trading session only unless otherwise mentioned.
- Stop-loss levels are given so that there is a level below/above, which the market will tell us that the call has gone wrong. Stop-loss is an essential risk control mechanism; it should always be there.
- Book, at least, part profits when the prices reach their targets; if you continue to hold on to positions then use trailing stops to lock in your profits.
We do discussion is Live market to update Nifty levels If you are interested you can LIKE the page to get Real Time Updates.
Follow on Facebook during Market Hours: http://www.facebook.com/pages/Brameshs-Tech/140117182685863


