Fibonacci technique
Fib retracements
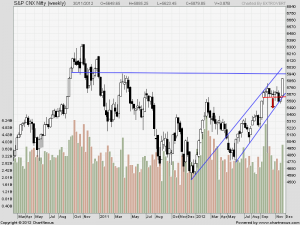
Fibonacci Ratios are drawn in above chart from 4555-5633 showing Fibonacci support and Fibonacci resistance. 5945Fibonacci resistance on Weekly basis
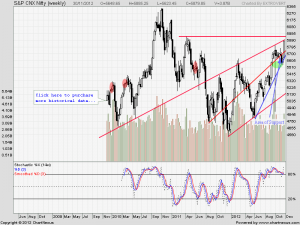
As discussed earlier Fibonacci fan helps in finding potential tops and Bottom of market from short term prospective. If we see the chart closely with Fibonacci fans 5930-5945 is level of resistance.
Nifty Weekly Chart
Nifty was up by 4.5% WoW basis, and bounced from trendline support of rising trendline. Weekly High of 5885 will continue to act as strong resistance and 5931-5945 will act as supply zone.
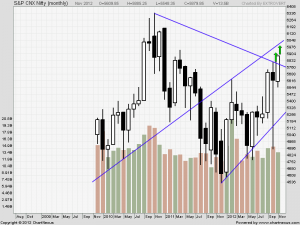
Trading Monthly charts
Close above 5217 is bullish for market for rest of year.Support on Monthly charts comes at 5697 and resistance at 5945.
Nifty Trading Levels
Nifty Trend Deciding Level:5885
Nifty Resistance:5945,6025 and 6069
Nifty Support:5825,5771 and 5720
Levels mentioned are Nifty Spot
Read the Weekly Analysis Part I
Let me go by Disclaimer these are my personal views and trade taken on these observation should be traded with strict Sl
We do discussion is Live market to update Nifty levels If you are interested you can LIKE the page to get Real Time Updates.
Follow on Facebook during Market Hours: http://www.facebook.com/pages/Brameshs-Tech/140117182685863
We are Planning to conduct training session in Mumbai in batch of 8-10 persons in Last week of December, Interested people can contact me on bhandaribrahmesh@gmail.com


