Global Economy has got some more shocks to live with in the coming week
Issue1: U.S. Authorities SUES 17 BIG BANKS for $196Billions OVER MORTGAGES during SUB-Prime Crises
Issue2:“GREECE” IS BACK as Germany and other Creditors not satisfied with Austerity measure and
next round of bailout in on HOLD
Nifty Hourly
Nifty Hourly Chart has shown a vertical rise move from the Low of 4806 on Monday. Nifty got resisted at 5113 on Opening Hours on Friday as it was an Hourly resistance.5058-5067 are important resistance on Hourly chart and crossover of same will lead to a Bullish momentum in NIFTY.
Nifty Daily
 Nifty on Daily chart moved above the crucial resistance of 5015 which was double top formation and after than made a High of 5113.
Close above 5015 (Based on US sell off we are most liely to open 1% gap down)is required to carry forward of momentum,but we had some peculiar/interesting data to be interpret on Fridays Close@5040.
- Nifty Futures Volume was lowest in last 11 trading sessions. Reversals should always happen on large volumes else its a fake reversal.
- Total F&O Turnover was only 83000 Cores
On Downside break of 5000 will be psychological blow to Bulls. Below 4965 Downside momentum will get accelerated to 4933 and 4895 levels.
Nifty Weekly
 Nifty gave a swift and fierce rally of 300 points in matter of 3 days .Bear market rallies are sharp and swift as seen from the last week.
We have discussed the Possibility of same in our Weekly Analysis Has Nifty Made the Short term Bottom?
Weekly trendline breakout has happened and market is still unable to move above it which is again a bearish sign.
Closing above 5116 on Weekly basis will be booster to BULLS and Closing below 4965 will be good for Bears
Nifty Monthly
On Monthly charts we had a fall of 9% in august and September is the month which is very volatile for equities so be cautious on your longs. There are plethora of Global and local problems (RBI rate hike,Food Infaltion, Slowdown in economy)
Correction will always be fast and swift and will not give you time to exit if you live in HOPE of an recovery,These are volatile times and advise all of you to be fast in your trade execution if you are intraday or swing trader.
Nifty Fibo
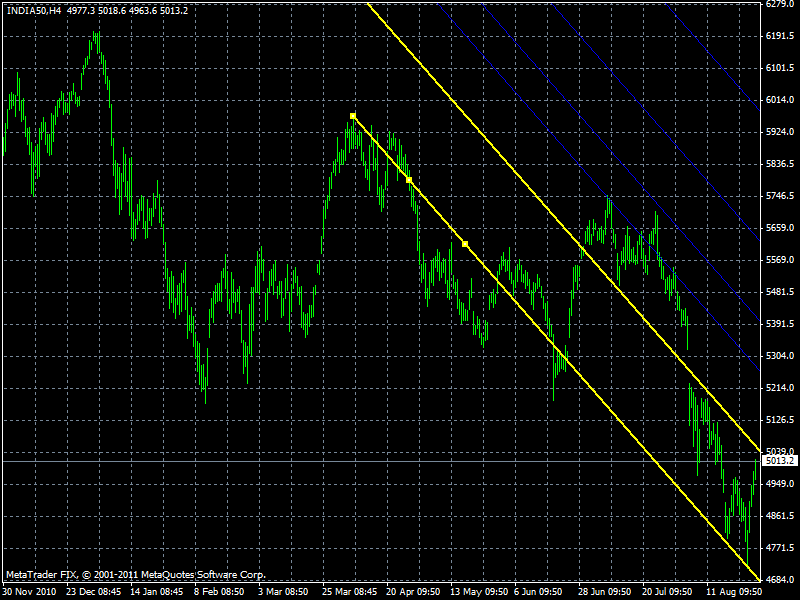
AS per the Fibo levels from the High of 5740 and low of 4718 Nifty retraced back 61.8% retracement @5113 and fall back. SO this would make a case of continuation of downtrend as soon as 4965 is taken out and retest of lows of 4720.
If market is able to break is able to break 5116 on weekly closing basis than it will move ahead and fill the gap till 5320.
 I have drawn Fibo Channel in a 4 Hours chart of Nifty and it works really good. Real test of this analysis will come next week if Nifty start falling after touching the Upper end of channel marked in YELLOW line.
We have a gap to be filled on downside from 4747 to 4806 which need to be watched closely
Nifty Trend Deciding Level:5015
Support:4975,4898,4827 and 4796
Resistance:5065,6113,5178
STAY DISCIPLINED !!


relief rally stopped at 38.2% retracement level, not at 61.8% retrace ment level as stated under Nifty Fibo
Dear Sir,
There are two aspects to Fibo 1. re tracements 2.extension
What i have assumed is Fall has not stop and its a temporary bottom in such scenarios we use Fibo Extension.
What u have assumed is short term bottom is in place so u are using retracement.
It depends how u see the chart and Bottom line you should make money in market.
Rgds,
Bramesh
sir your observations are superb that why I am fan of yours!
Thanks a lot Sir…
HI Bramesh,
A thorough review of events and charts also 😉
.
Thanks a lot Sir !!