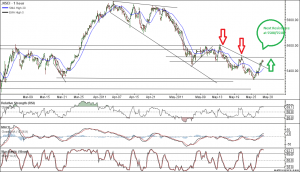
Nifty Hourly Chart
Nifty Did a U-Turn again and took everyone by surprise on its move on Last thursday. This move shows highly unpredicatble nature of market.
Market always follow the path of Least Resistance
On Hourly chart market has broken the downward trending trendline as Shown in chart. Next level of Resistance comes @5510 on Hourly charts.
Nifty Daily Chart
20 SMA is a tough resistance to crack on daily chart and in Extreme short term,Closing above 5485.8 will give another boaster to bulls to continue the trend on upside.
 On Daily charts next level of resistance comes around 5518 the lower end of Flag and Pole pattern breakdown. This is also an Important swing high formed before this uptrend and its should be crossed for further upside.
MACD is going to trigger a Buy and market closed above 5 EMA High on Daily charts .
Nifty Weekly Chart
 On Weekly charts Nifty broke its short term trendline during the week but quickly recovered the same during the last 2 days indicating the Demand coming on downside and decreasing of Supply pressure on upside.
Trend Deciding Level:5518
Weekly Resistance:5555,5587,5621
Weekly Support:5445,5375 and 5329.
Break of 5329 will lead to a panic selling in market and we can revisit the levels of 5177
Nifty OI Chart
Based on OI charts the Weekly range looks in Between 5700 and 5300


Market is not highly unpredictable Bramesh. if you use dow theory you will find a trend line support from where market has taken a u turn.
Hope you find this helpful.
Hi Sir,
I have mentioned the trendline you have mentioned on Charts.
By unpredicatble i meant the 40 point jump we saw on Thursday Dow theory will never be able to predict that move 😉
Thanks for views appreciate them.
Rgds,
Bramesh