Nifty Hourly
 Nifty Hourly Charts are respecting the trend lines both on Upper end@5600 and on lower end @5440. Break on either side only will give range breakout. from this tight 200 point range.
Hourly was oversold and hence Nifty showed the much expected bounce but unable to cross the upper trendline @5600.
Market always move the path of Least resistance.
As we are trading below 200 DMA@5762 which makes us into bear market and Bear Markets rallies are swift like on Friday.
Do not get swayed away by one day one always look at the larger trend in the market(Weekly/Monthly).
Nifty Daily
 As I have been telling in previous posts we are forming a bearish Flag and Pole pattern with a breakdown level @5440
Pattern will be neglected once we close above 20 SMA@ 5632 and 50 SMA@5649
Indicators are on oversold Region, Indicators can remain oversold and overbought extended period of time in a Trending market.
Nifty Weekly Chart
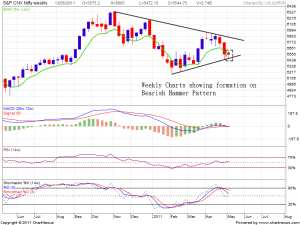
Nifty Weekly Charts is forming a Hammer Formation on Weekly charts, if 5472 breaks we are in for more severe fall for the coming week.
Weekly charts have again taken support at trend lines and a break of the lower trendline will be a bearish in nature.
Weekly Stochastic has given a SELL Call.
The biggest sign for impulsive downtrend Nifty took 9 sessions to fall from 5912 to 5444. To reach a high of 5605 Nifty took 6 session not even retraced 38 % of the fall. This is an indication for pause before further fall.
Levels to Watch
Trend Deciding Level:5605
Weekly Resistance:5673 and 5741
Weekly Support:5472,5405 and 5343
Trade with the Trend and Do not let you emotions ruin your trading account.
Need Professional Advise in trading in Nifty Intraday/Positional Contact@09985711341


Bramesh Sir,
Please put some analysys on Tata Steel.It has broken triple bottom of 580 and closed below it.
Thanks
Sachin P
Dear Sachinji,
I have done the latest analysis of TISCO as per your request
Rgds,
Bramesh