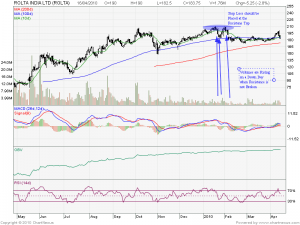
Double Tops:
A double top is a reversal chart pattern which is defined by a chart where a Stock makes a run up to a particular level, then drops back from that level, then makes a second run at that level, and then finally drops back off again.
 In its most basic sense what the double top pattern is saying about supply and demand forces is that demand is out pacing supply (buyers are winning) up to the first top causing prices to rise, and then the equation flips and demand is no longer out pacing supply (sellers are winning) causing prices to fall. After then falling back the buyers make another run at the same price and then after failing to break that level for a second time, sellers take control and keep the upper hand causing prices to sell of even more dramatically after the second top than they did after the first. For double bottoms the reverse is true.
A double bottom is also a reversal pattern in the stock markets which is the exact opposite of a double top. To form a double bottom a stock makes a run down to a particular level, then trades up from that level then makes a second run down to at or near the same level as the first bottom, and then finally trades back up again
Double Top Trading Strategy
For confirmation that a double top has actually formed and that a reversal in the uptrend is at hand, a common strategy is to look for declining volume going into the second peak and rising volume on a break below the bottom of the trough which has formed between the two peaks (support).
As seen in ROLTA Chart you can easily see the formation of Double Top around 208 Levels and than price corrected till 50 SMA and than a bounce till 208 Levels again and than ROLTA crashes till 170 levels.Stock Should be shorted with a SL of 210 and Target of 200
Double Top if not broken always act as Resistance
Double Bottom:
Double Bottom is Mirror Copy of Double top and self explanatory.
Double Bottom Trading Strategy:
The strategy here is to look for declining volume going into the second trough and rising volume on the break of the peak which has formed between the two troughs (resistance). Once you spot the double bottom the trade is entered The stop order is then placed just above the last trough.
As can be seen in Chart ABAN made a Low of 1048 two times Formation of Double Bottom and after that stock gave a good rally.Ideally Keep a target of 10% after a Double Bottom is formed and SL at Double Bottom
Double Bottom if not broken always act as Support


