


A Market at War: FIIs Unleash an All-Out Bearish Assault as Retail Catches the Falling Knife
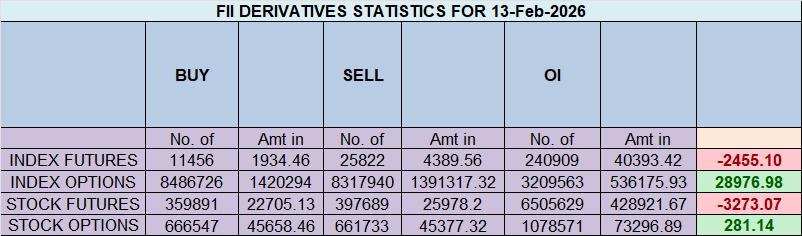
On February 13, 2026, the Nifty Index Futures market became a theater for one of the most extreme institutional-versus-retail standoffs on record. Foreign Institutional Investors (FIIs) did not just maintain a bearish stance; they launched an all-out offensive, culminating in a colossal net short of 9,902 contracts.
This was not a quiet sell-off. It was a declaration of war. Critically, this institutional onslaught was met head-on with defiant buying from retail clients, resulting in a significant surge in net Open Interest (OI) of 2,906 contracts. This is the ultimate signature of a market in deep conflict, with both sides aggressively bringing new, high-conviction capital to fund their opposing views.
Decoding the Data: Two Armies Building for a Climactic Battle
1. The FII Bears: A Masterclass in Maximum Conviction
The FIIs’ actions were a brutal and unequivocal statement of their bearish conviction. Their strategy was a devastating two-pronged attack:
-
They added a massive 8,654 new short contracts, building a formidable wall of supply.
-
Simultaneously, they dumped a huge 5,712 long contracts, demonstrating a complete and total abandonment of any bullish case.
This has pushed their positioning to an extreme 22% long versus 78% short (ratio 0.24). This is not a hedge; this is a massive, directional, institutional bet on a significant market decline.
2. The Client Bulls: Unflinching and Fearless Buying
In a perfect and dangerous mirror image, the retail clients met this wall of selling with unflinching optimism.
-
They valiantly added 8,773 new long contracts, willingly catching the falling knife and providing the bids for the FIIs’ massive sell orders.
-
This has cemented their positioning at a peak of bullish euphoria: 66% long versus 32% short, resulting in an extremely high ratio of 2.18. They are positioned in direct and total opposition to the institutional smart money.
Key Implications for the Market
-
An Explosion in Volatility is Imminent: The market is now a powder keg. This level of extreme polarization, fueled by a fresh injection of capital (rising OI), is fundamentally unstable and cannot last. The resolution will be a violent, high-velocity price shock.
-
A Historic “Smart Money vs. Retail Money” Divergence: The positional chasm between the FIIs and the clients is at a maximum. History overwhelmingly shows that these standoffs are resolved in favor of the institutions.
-
The Ultimate Contrarian “Red Alert”: This is a textbook contrarian signal flashing at maximum intensity. The combination of peak retail bullishness and peak institutional bearishness is the most dangerous possible setup for the longs.
-
The “Pain Trade” is Obvious: The path of maximum financial pain is a significant decline that would trigger a devastating liquidation cascade from the massive and highly exposed base of retail longs, a scenario that would be hugely profitable for the institutional shorts.
Conclusion
Disregard any small, choppy price movements. The only story that matters is the colossal, unsustainable buildup of opposing forces, confirmed by the surging Open Interest. The FIIs have declared all-out war on this market, and retail has defiantly accepted the challenge. A major, violent, and likely very painful resolution is no longer a question of “if,” but “when.”
Last Analysis can be read here
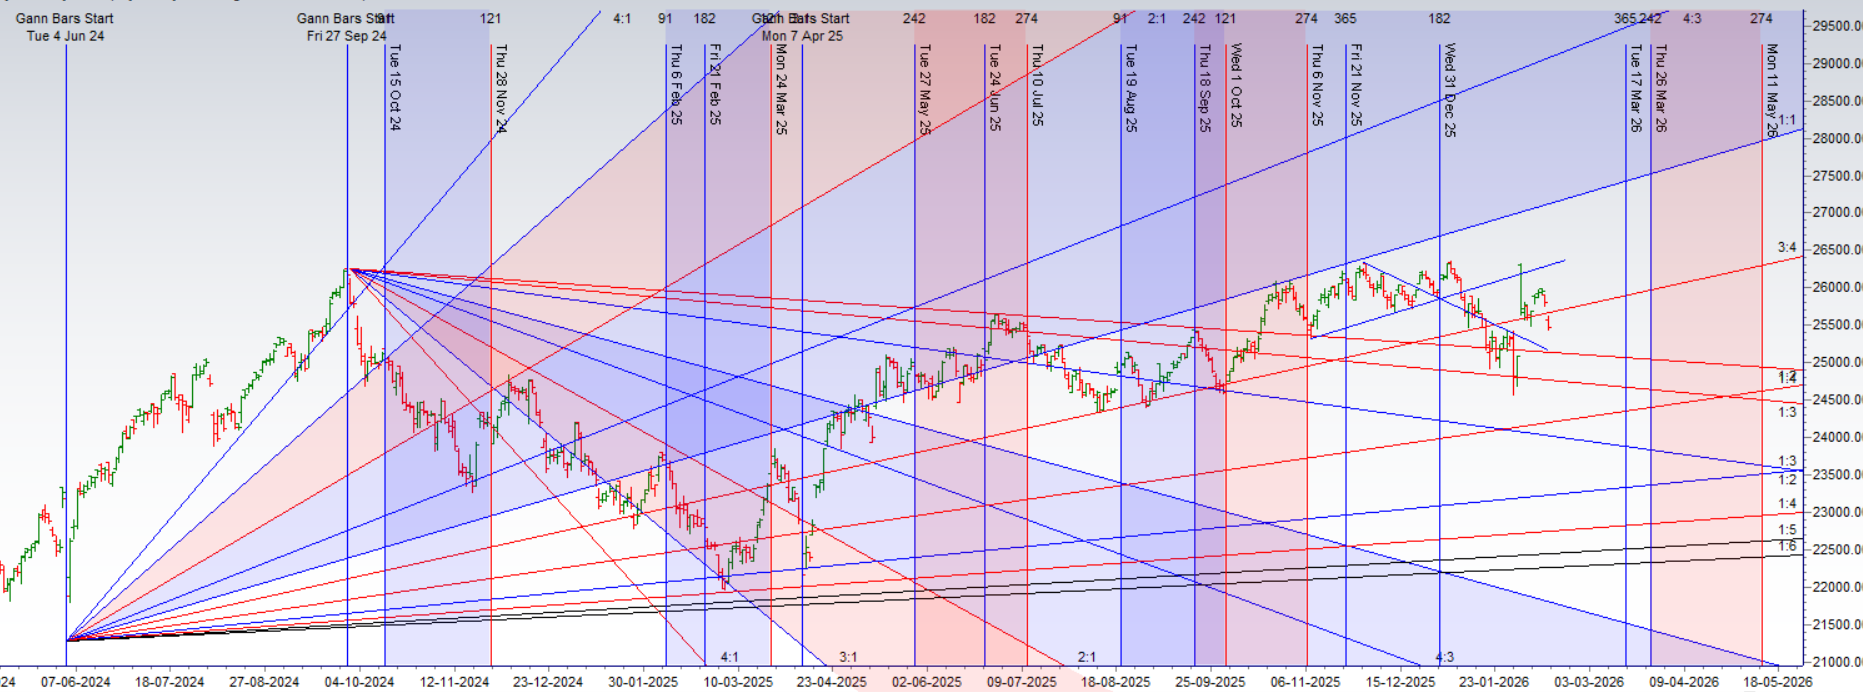
The market has once again bowed to the power and precision of our multi-disciplinary analytical model. The gap-down opening unfolded exactly as forecast, driving the Nifty on a direct and unerring path to its pre-calculated destination: the critical octave point of 25,456. The market has now landed, with textbook precision, on a level of profound technical and cyclical significance, signaling that the current, aggressive phase of selling has likely reached its climax.
This is not just a random bounce from a support level. This is a “price-time squaring” event of the highest order. The market’s arrival at this specific price level is coinciding with two major, independent astrological catalysts for a turn:
-
Saturn Changes Sign: Saturn is a major, slow-moving planet. Its ingress into a new sign is a major background event that can coincide with the end of one structural market phase and the beginning of another.
-
Bayer Rule 15: This important rule also signaled that a major move or turning point was imminent.
The powerful confluence of price hitting a Gann octave point at the exact same time as two major astro-cycles are in effect is the definitive signature of a short-term bottom.
The Bullish Counter-Attack: The Path of the Relief Rally
The violent selling pressure is now expected to abate, and a powerful relief rally is the most probable outcome. The path of this counter-trend move is defined by a clear sequence of resistance targets.
-
The First Objective: A rally towards the Gann monthly trend change level at 25,529.
-
The Primary Target: If the initial momentum is strong, a more significant rally towards the major resistance zone of 25,677 – 25,729 is the high-probability objective.
The Bearish Invalidation: The Line in the Sand
While a relief rally is the primary expectation, the bears have not been vanquished. They have a clear and unambiguous trigger that would invalidate the “short-term bottom” thesis and signal a new, catastrophic leg down.
-
The Breakdown Trigger (A Move Below 25,400): A decisive and sustained break below this level would be a major technical failure. It would signify that the Gann support has been shattered and that the market’s decline is far from over. This is the trigger for a new, powerful fall towards 25,225 and 25,108.
Conclusion
The market has flawlessly executed our bearish forecast, arriving at a pre-defined point of technical and cyclical exhaustion. The conditions are now perfectly aligned for a significant relief rally from the 25,456 pivot. The focus now shifts from riding the downtrend to capturing this powerful counter-trend move, with an eye on the 25,529 and 25,677 targets. However, discipline remains paramount; a failure at the 25,400 support would immediately signal that a much deeper and more dangerous decline is underway.
Nifty Dec Futures Open Interest Volume stood at 1.61 lakh cr , witnessing addition of 9 Lakh contracts. Additionally, the increase in Cost of Carry implies that there was addition of SHORT positions today.
Nifty Advance Decline Ratio at 06:44 and Nifty Rollover Cost is @25405 closed above it.
In the cash segment, Foreign Institutional Investors (FII) sold 7395 cr , while Domestic Institutional Investors (DII) bought 5553 cr
The Nifty options market is screaming a message of overwhelming bearish dominance and a market in the firm grip of sellers. A profoundly negative Put-Call Ratio (PCR) of just 0.45 signals a state of extreme pessimism, indicating that the open interest in call options is more than double that of puts. This is the unmistakable signature of a market where aggressive call writers have built a colossal wall of resistance, reflecting their high conviction that any attempt at a rally will be brutally suppressed.
This heavy bearish sentiment has pushed the market below its financial center of gravity, the Max Pain point of 25,500. With the spot price trading at 25,471, the index is in a position of technical weakness, confirming the control of the sellers.
A deep dive into the participant data reveals a classic “smart money” vs. “retail money” conflict:
-
Foreign Institutional Investors (FIIs) are expressing deep caution. They are net buyers of call options for upside exposure, but simultaneously are massive net sellers of put options. This is a confident, bullish-to-neutral strategy, as they build a support floor under the market.
-
Retail appears to be on the opposite side, likely the aggressive sellers of the calls, contributing to the extremely low PCR.
This has forged a clear and formidable battlefield:
-
Resistance: A massive, multi-layered “Great Wall of Calls” stands at the 25,600 and 25,800 strikes, serving as the ultimate ceiling. The 25,500 Max Pain level is the immediate resistance.
-
Support: A significant support floor has been built by put writers (led by FIIs) at 25,300. The ultimate line of defense is at the psychological 25,000 level.
In conclusion, the Nifty is in a high-tension standoff. While the overall sentiment is profoundly bearish, a powerful institutional force is attempting to build a support base. The market is trapped, and a major catalyst will be required to break the deadlock.
For Positional Traders, The Nifty Futures’ Trend Change Level is At 25606. Going Long Or Short Above Or Below This Level Can Help Them Stay On The Same Side As Institutions, With A Higher Risk-reward Ratio. Intraday Traders Can Keep An Eye On 25598 , Which Acts As An Intraday Trend Change Level.
Nifty Spot – Intraday Chart Observation
Technical Setup: The index is approaching critical breakout levels. Watch these zones for price action confirmation:
-
Strength (Upside): Momentum is expected to pick up if Nifty sustains above 25512. In this scenario, the immediate resistance levels are 25555, 25595 and 25630.
-
Weakness (Downside): The trend technically weakens if the index slips below 25466 This could open the path towards support levels at 25424, 25400 and 25343.
Wishing you good health and trading success as always.As always, prioritize your health and trade with caution.
As always, it’s essential to closely monitor market movements and make informed decisions based on a well-thought-out trading plan and risk management strategy. Market conditions can change rapidly, and it’s crucial to be adaptable and cautious in your approach.
► Join Youtube channel : Click here
► Check out Gann Course Details: W.D. Gann Trading Strategies
► Check out Financial Astrology Course Details: Trading Using Financial Astrology
► Check out Gann Astro Indicators Details: Gann Astro Indicators