


Disclaimer
This analysis represents the highest-probability forecast derived from expert, multi-decade historical evaluation of astrological signatures and their documented correlation with market psychology and price action.
No Guarantee
This is not a guarantee of future market performance. Financial markets are influenced by numerous dynamic and unpredictable real-world factors. All trading and investment activities carry significant risk, including the potential loss of principal.
Educational Purpose Only
This content is strictly for informational and educational purposes and should not be construed as financial advice or a recommendation to buy, sell, or trade any financial instrument.
Consult a Professional
We strongly advise you to consult a qualified financial advisor before making any investment decisions. Any actions you take based on this analysis are solely your responsibility. We assume no liability for any financial profits or losses that may occur.
Theme for Sensex: The Structural Breakdown and The Sentiment Collapse
The theme for the Sensex is a textbook failure at a key time pivot, leading to a structural breakdown and a full-blown collapse in market sentiment. The week is designed to punish complacency and aggressively re-price risk to the downside. The Gann Emblem Date on Monday serves as the last point of failure for the bulls. The Mercury-Saturn square on Tuesday provides the concrete, negative catalyst that shatters support and initiates a high-velocity downtrend. This is not a dip; it is a change in character. The decline will evolve from a logical, news-driven event into an illogical, panic-driven cascade under the subsequent Mercury-Neptune square. The narrative for Sensex is one of a systematic dismantling of the bullish structure, culminating in an emotional, oversold low by the end of the week.
For a Detailed Day by Day Forecast with Neural Analysis Please watch the below video
SENSEX Harmonic Pattern
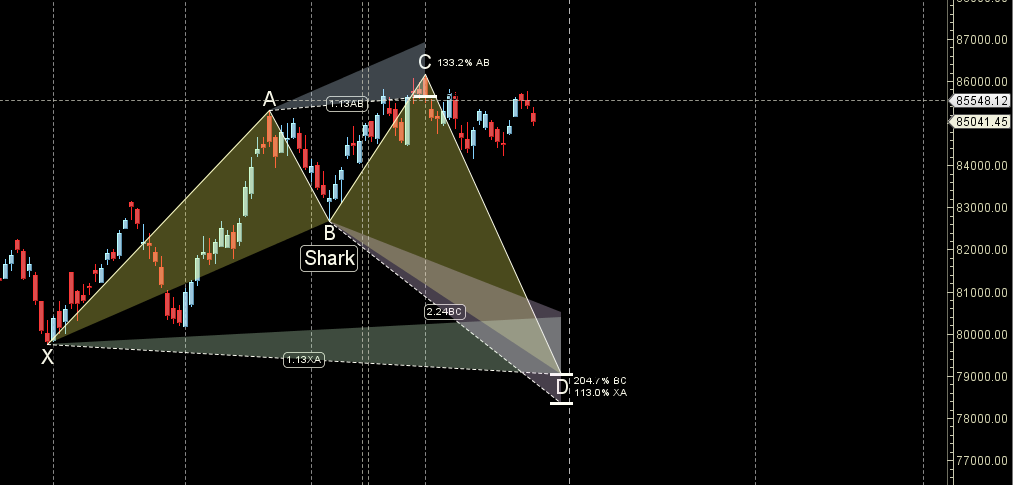
Sensex unable to cross SHARK pattern PRZ zone of 86000 fall towards 84700/84500
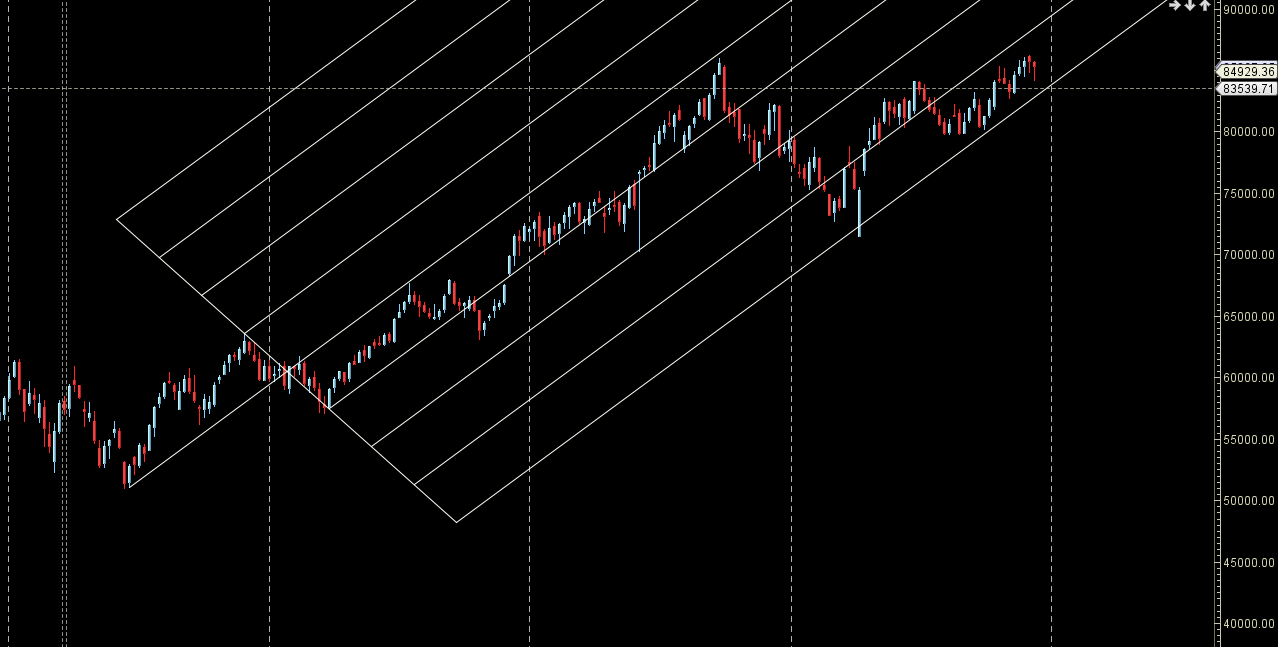
SENSEX Gann Angles

Sensex is back to its 1×1 gann angle.
SENSEX Supply and Demand

Self Explanatory Chart
Nifty 50 Forecast for 2026: “The Year of the Whip” – A Master Cycle Analysis
SENSEX Time Analysis Pressure Dates
Key Pivot Dates: Watch 30 Dec
SENSEX Weekly Chart
Weekly Lower Low with NR21
SENSEX Monthly Charts
86100 is Monthly resistance zone 84811 is Support zone.
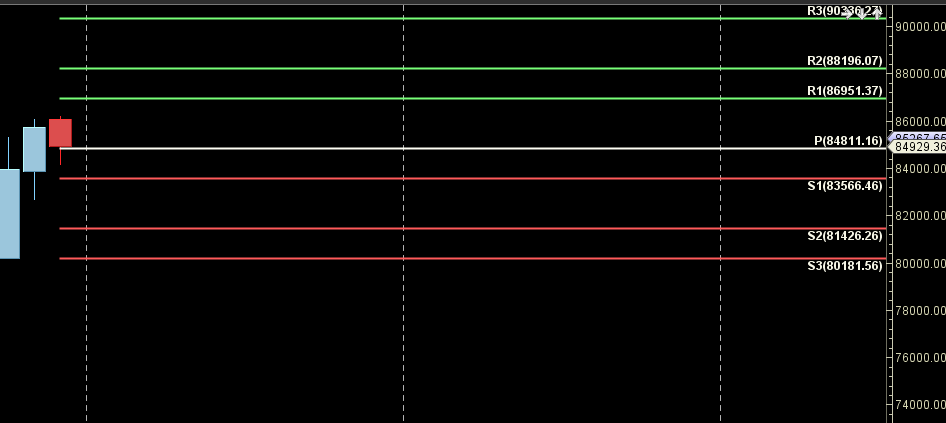
SENSEX Weekly Levels
SENSEX Trend Deciding Level: 85020
SENSEX Resistance: 85310,85600,85890,86180,86470
SENSEX Support: 84730,84440,84150,83888,83555
Levels mentioned are SENSEX Spot
Learn More:
W.D. Gann Trading Strategies – Learn how to decode markets using price, time, and geometry.
Trading Using Financial Astrology – Discover how planetary motion impacts market behavior and how to trade it effectively.
Ready to Trade Like a Time-Master?
Join our one-on-one mentorship to master astro-timing, Gann analysis, and institutional-grade setups.
Call: 09985711341
Email: bhandaribrahmesh@gmail.com