


Is history about to rhyme?
If the 60-year W.D. Gann Master Cycle holds true, we are approaching a pivotal “duality” year in 2026. This cycle suggests a year defined by two distinct emotional extremes: a euphoric high driven by speculation, followed by a sobering reality check.
To navigate the path ahead, we look back exactly 60 years to the 1966 “Credit Crunch.” By overlaying the 1966 Dow Jones pattern with the specific astrological and technical signals arriving in 2026, we can construct a roadmap for the coming volatility.
Here is the 2026 Forecast, modeled on the 1966 template.
Phase 1: The “False Breakout” (January – February 2026)
The Historical Context (1966):
In early 1966, the Dow Jones Industrial Average flirted with the psychological “magical” level of 1,000. It created a sense of permanent prosperity, touching an intraday high of ~1,000.50 on February 9, 1966. However, it failed to close above this level, marking a monumental top.
The 2026 Forecast:
We anticipate the “AI Bubble” will reach its zenith during this window. The Dow Jones and S&P 500 will likely spike to new All-Time Highs, driven by retail FOMO and a final, vertical surge in technology stocks.
-
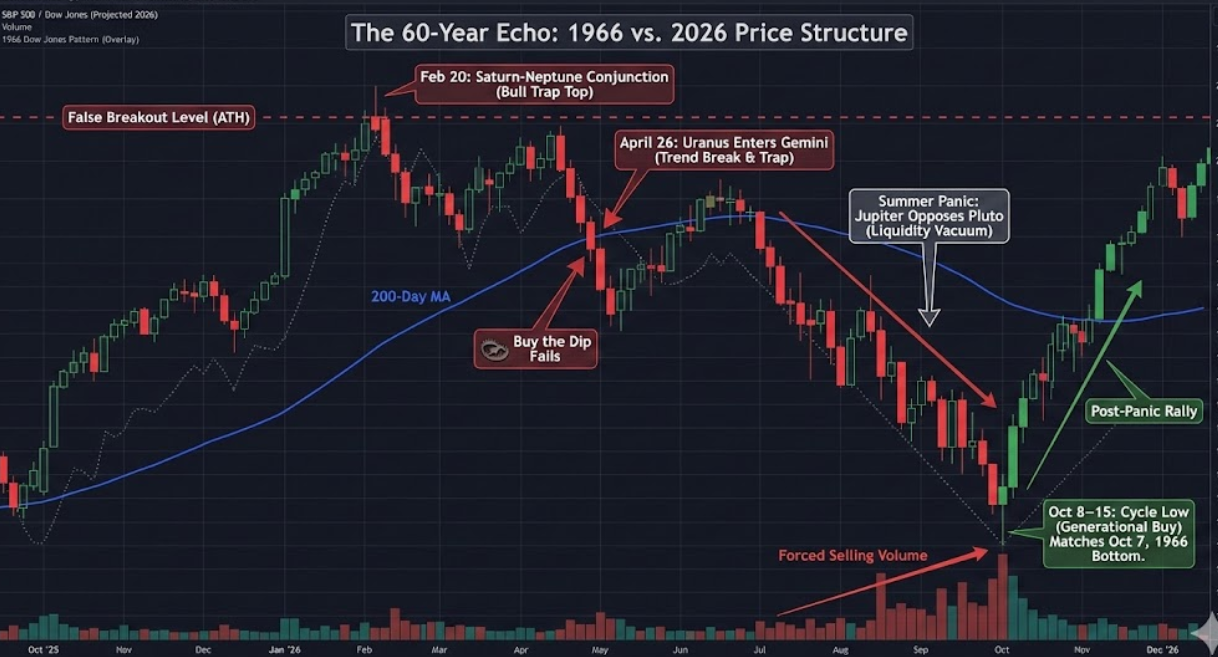
The Trigger Date: February 20, 2026
-
The Astro Signal: Saturn conjoins Neptune at 0° Aries.
Why this matters: Saturn represents structure and reality. Neptune represents dreams and bubbles. They meet at the “World Point” (0° Aries). Historically, this aspect signifies the bursting of the bubble. It is the moment when the “Dream” of infinite AI growth runs into the “Wall” of regulation, energy limits, or profitability concerns.
Strategy: This is the distribution zone. Smart money will sell into the rally while the media claims “This time is different.”
Phase 2: The “Spring Slide” (March – May 2026)
The Historical Context (1966):
After the February peak, the market didn’t crash immediately. It suffered a “slow bleed” throughout the spring as the Federal Reserve unexpectedly tightened credit to fight inflation.
The 2026 Forecast:
The market narrative will likely shift from “Growth” to “Liquidity.” We may see a sudden spike in bond yields or a significant repricing of risk assets.
-
The Catalyst: April 26, 2026
-
The Astro Signal: Uranus enters Gemini.
Why this matters: Uranus is the planet of disruption; Gemini rules communication and intelligence. This transit suggests sudden volatility specifically in the AI and Tech sectors (Gemini). A leading tech giant may miss earnings, or a geopolitical cyber-event could shake confidence.
Technical Target: Expect the market to break its 200-day moving average, trapping “buy the dip” investors who assume the bull run is still intact.
Phase 3: The “Summer of Panic” (June – September 2026)
The Historical Context (1966):
The most painful period of the cycle. By August 1966, the “Credit Crunch” was in full swing, and liquidity dried up completely. The slow bleed accelerated into panic selling.
The 2026 Forecast:
This aligns with a potential resurgence of inflation or a sovereign debt scare. Central banks may be forced to keep rates higher than the market can handle, causing a liquidity squeeze.
-
The Astro Signal: Jupiter enters Leo (July 2026) and opposes Pluto in Aquarius.
-
The Impact: This aspect represents “power struggles” and “wealth destruction.” The “Magnificent Seven” (tech leaders) could face their steepest correction of the cycle during this window.
Sentiment: Fear shifts from “correction” to “bear market.” Expect the media to begin comparing 2026 to the 2000 Dot-com bust or the 1966 Credit Crunch.
Phase 4: The “October Low” (October 2026)
The Historical Context (1966):
The carnage finally ended on October 7, 1966, with the Dow down roughly 25% from the highs. This marked the absolute bottom for the cycle.
The 2026 Forecast:
We are looking for a major cycle low in early-to-mid October.
-
The Opportunity: This will be a “Generational Buy” signal. However, leadership will likely rotate. Look for value in commodities, real assets, or the next wave of tech (post-shakeout). Valuations will finally be reset to attractive levels.
-
The Recovery: Just like in late 1966, a sharp, violent rally should begin in November/December 2026, catching bears off guard and setting up the next bull leg into 2027.
Summary: Critical Turning Points
| Event | 1966 Date (Actual) | 2026 Date (Projected) | Signal & Action |
| The Top | February 9 | February 20 (Saturn/Neptune) | SELL. The “Dream” ends. |
| The Breakdown | April / May | April 26 (Uranus enters Gemini) | SHORT. Tech sector volatility. |
| The Panic | August | August / September | HOLD CASH. Liquidity crisis. |
| The Bottom | October 7 | October 8–15 | BUY. The “Capitulation” low. |
The Bottom Line for Traders
If you are following the 60-year cycle, the roadmap is clear:
-
Enjoy the ride in 2025, but use this time to prepare your exit strategy.
-
Watch February 2026 like a hawk. If the market is making a new high around the Saturn/Neptune conjunction (Feb 20), treat it as a “bull trap.”
-
Prepare for a “Tech Wreck” in Spring 2026. The leadership of the market will likely rotate out of Semiconductors and AI and into defensive assets during the drop.
-
Cash is King until October 2026. Patience will be rewarded with excellent entry prices in Q4.
Disclaimer: This analysis is based on historical market cycles and astrological patterns. It is for educational purposes only and does not constitute financial advice. Always perform your own due diligence.
Wonderful piece of warning. Thanks Brameshji.