


Beneath the Surface: FIIs Quietly Accumulate Longs Amid Retail Confusion
On the surface, the trading session of November 27, 2025, appeared to be a day of quiet indecision. The headline data showed a near-neutral instance from Foreign Institutional Investors (FIIs), with net selling of just 396 contracts. However, to take this at face value would be to completely miss the seismic shift occurring beneath the market’s surface. The real story is told by the significant increase in net open interest (OI) of 1,166 contracts and, most importantly, the powerful underlying actions of both FIIs and retail traders.
(Note: There is a discrepancy between the FII headline figure and their activity breakdown. We will analyze the more detailed and powerful signal from the breakdown data.)
The FII’s Strategic Pivot: Accumulation, Not Neutrality
Ignoring the misleading headline, the FII breakdown reveals a powerful and bullishly strategic move. The FIIs executed a classic two-pronged offensive:
-
They ADDED 2,000 new long contracts: This is not profit-taking. This is the initiation of fresh bullish bets, signaling a growing conviction that the market is poised for an up-move.
-
They COVERED 1,484 short contracts: This action signifies the capitulation of their old bearish view. They are actively de-risking from the short side and reducing their bearish exposure.
Combined, this is an unequivocally bullish flow of funds. The FIIs are simultaneously building a new bullish foundation while dismantling their old bearish one. This is the clearest signal of accumulation and a positive sentiment shift we have seen from the “smart money.” Their overall legacy positioning remains heavily short (19:81), but their actions today are a far more powerful and forward-looking indicator of their future intentions.
The Retail Confusion: A Market Paralyzed by Indecision
In stark contrast, the Client (retail) segment is a picture of profound and total confusion. They added thousands of positions on both sides of the market: +2,636 long contracts and +2,739 short contracts.
This is the signature of a market participant that has been completely whipsawed. Retail is now hedging frantically, expecting a major move but having zero conviction on the direction. They are simultaneously buying the dip and shorting the rip, a low-conviction strategy that often precedes being caught on the wrong side of a major trend.
The Powerful Divergence: Conviction vs. Confusion
This creates a classic and powerful market divergence that savvy traders look for:
-
FIIs (The Smart Money): Are displaying clear directional conviction (upside) by adding longs and covering shorts.
-
Clients (The Crowd): Are displaying maximum confusion by adding both longs and shorts in almost equal measure.
History has repeatedly shown that when institutional conviction clashes with retail confusion, the market almost always resolves in the direction of the conviction. The FIIs are quietly accumulating, and the confused retail positioning is creating the perfect environment for a potential squeeze.
Conclusion:
Ignore the neutral headline figure. The real story of the day is the powerful, bullish accumulation by the FIIs, hidden beneath the surface of a seemingly quiet market. Their dual action of adding longs and covering shorts is a high-conviction signal that should not be ignored. As retail traders remain paralyzed by indecision, the institutional tide is turning positive. The risk is now building for a sharp move higher, which would catch the newly added retail shorts completely off guard. The smart money has placed its bet.
Last Analysis can be read here
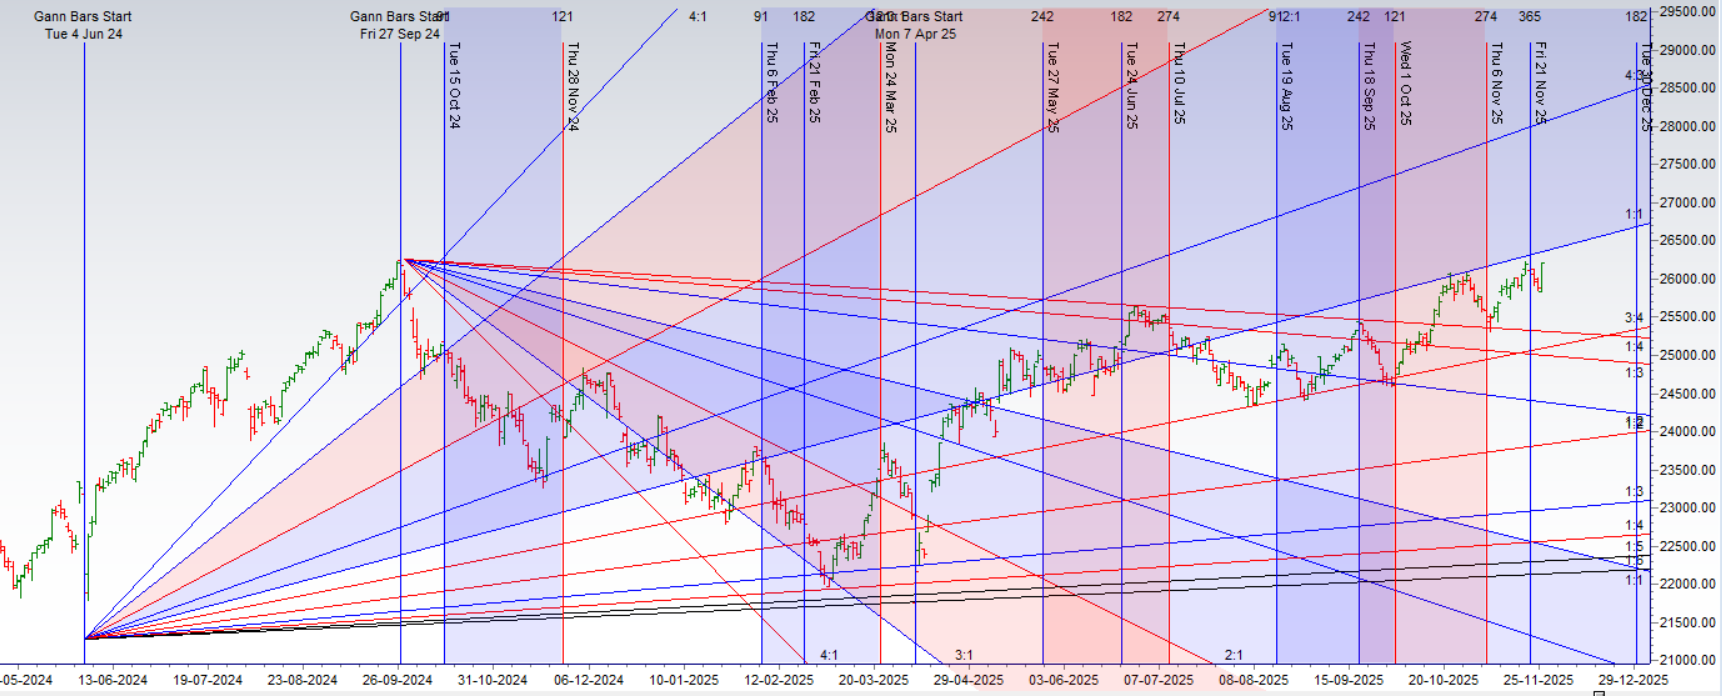
Nifty’s Hollow Crown: A Fragile New High as Major Astro Cycles Warn of a Reversal
Today, the Nifty 50 etched a new all-time high in the history books, a moment that on the surface appears to be a crowning achievement for the bulls. The previous peak of 26277, made on September 27, 2024, was finally surpassed. However, for a vast majority of traders and investors, this is a hollow and painful victory. The celebratory headlines are masking a deep and troubling divergence that signals profound weakness beneath the market’s surface.
This is not a healthy, broad-based rally. This is a narrow, index-management-driven illusion, and a powerful confluence of major astrological and cyclical events is now warning that this illusion is about to be shattered.
The Great Divergence: An Echo of the 2018-2019 Grind
The most critical observation of the current market is the stark contrast between the index’s performance and the health of the average portfolio. While a handful of heavyweight stocks have propelled the Nifty to its new peak, the reality is that the broader market has been in a silent bear market. Most portfolios are showing drawdowns of 20% to 50%.
This is not a new phenomenon. We are seeing a direct echo of the treacherous 2018-2019 period, where the index repeatedly ground out new highs while the majority of mid-cap and small-cap stocks were in a state of relentless decline. This is a dangerous environment, as the headline number creates a false sense of security, luring in unsuspecting capital just as the underlying market structure is decaying.
Adding a layer of cyclical significance to this, the new high has arrived exactly 14 months after the previous one—a period of precise time symmetry that often marks a major culmination point rather than the start of a new, sustainable trend.
An Imminent Storm: A Rare Confluence of Major Astro Events
The market is now walking directly into a perfect storm of astrological catalysts. The convergence of multiple, powerful, and often conflicting celestial events on a single day dramatically increases the probability of a major pivot and a significant expansion in volatility. Here is what is on the immediate horizon for Monday:
-
Saturn Stations Direct in Pisces: This is the heavyweight event. Saturn is the planet of reality, karma, structure, and consequences. A planet stationing (appearing to stand still before changing direction) is when its energy is at its absolute maximum intensity. Saturn turning direct is a major “reality check” moment. It often brings an end to periods of illusion and forces the market to confront the underlying, hard truths.
-
Bayer Rule 2 – A “Big Move” Down Signal: We have a direct and historically potent bearish signal coming into play:
“Bayer Rule 2: Trend goes down within 3 days when the speed difference between Mars and Mercury is 59 minutes. Leads to Big Move.”
This is not an ambiguous signal. It explicitly warns of a downward trend and a “Big Move.” This arriving just as the market prints a fragile new high is an ominous warning. -
Mercury Conjunct Jupiter (Helio): This aspect often brings a wave of optimism, news, and a potential for a large move. In this context, it could provide the fuel for a final, deceptive gap-up opening on Monday, sucking in the last of the bulls before the heavier, more powerful energies of Saturn and Bayer Rule 2 take control.
The Strategic Outlook: Hedge or Face the Consequences
This powerful confluence makes a significant gap opening on Monday a very high probability. However, traders must not be lured into chasing it. The underlying astro-currents are signaling a major potential reversal.
The battle line for the market is now drawn with absolute clarity at 26110. This level is the “line in the sand.”
-
The Bullish Case (Tenuous): As long as the bulls can defend 26110 on a closing basis, they maintain a tenuous upper hand. This would be their only saving grace against the tide of bearish signals.
-
The Bearish Case (High Probability): A decisive break and close below 26110 will be the confirmation that the astro-signals have been triggered, the bull trap has been sprung, and the “Big Move” down is underway.
Conclusion:
We are witnessing a fragile, unhealthy, and narrow peak in the market, made on a precise long-term time cycle. A cluster of some of the most powerful astrological reversal signatures of the quarter is scheduled to hit the market on Monday. This is not a time for complacency or chasing new highs. This is a time for caution, risk management, and active hedging. The risk of a sharp, sudden, and punishing reversal is now exceptionally high. Watch the 26110 level with extreme vigilance; it is the key that will unlock the market’s next major trend.
Nifty Trade Plan for Positional Trade ,Bulls will get active above 26258 for a move towards 26338/26419. Bears will get active below 26177 for a move towards 26097/26017
Traders may watch out for potential intraday reversals at 09:21,11:24,12:58,02:45 How to Find and Trade Intraday Reversal Times
Nifty Dec Futures Open Interest Volume stood at 1.38 lakh cr , witnessing liquidation of 1.8 Lakh contracts. Additionally, the increase in Cost of Carry implies that there was closuer of SHORT positions today.
Nifty Advance Decline Ratio at 22:28 and Nifty Rollover Cost is @26320 closed above it.
In the cash segment, Foreign Institutional Investors (FII) sold 1996 cr , while Domestic Institutional Investors (DII) bought 3551 cr.
Market on a Knife’s Edge: Caution Prevails as FIIs Exit Bullish Bets
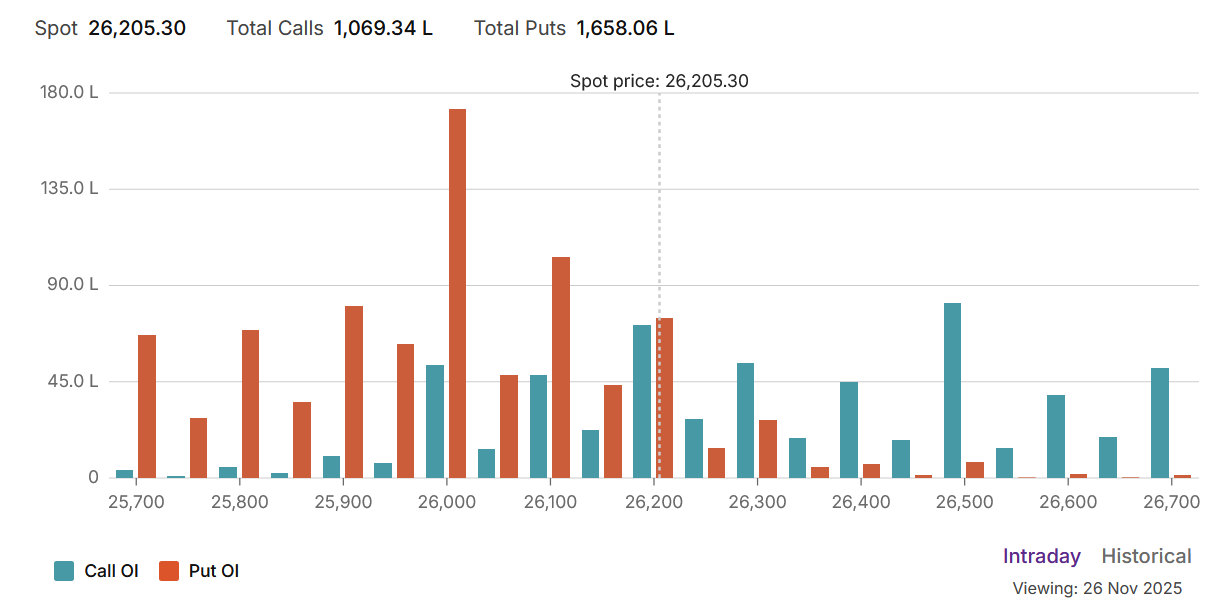
The options market is flashing clear signals of caution and underlying anxiety, even as prices remain at elevated levels. The Put-Call Ratio (PCR) stands at a wary 1.14, indicating that more Puts are being traded than Calls—a classic sign of hedging and fear. The Max Pain level at 26200 is acting as a powerful magnet for the market, representing the point of maximum financial pain for option buyers and a key level that option sellers will vigorously defend.
A deeper look reveals a critical divergence in strategy between institutional and retail players. Retail traders are playing a classic range-bound game, acting as significant net sellers of both Call options (betting the upside is capped) and Put options (betting the downside is protected). They are confidently selling volatility to collect premium, a strategy that profits from a market that goes nowhere.
In stark contrast, the “smart money” is sending a subtle but powerful warning. While FIIs were neutral on Calls, their most significant and telling action was in the Put options. They were major net buyers of Puts, primarily by covering a massive 42,000 of their existing short Put contracts.
This is a profoundly bearish signal. By buying back the Puts they previously sold, FIIs are exiting their “we’ll buy the dip” positions. They are no longer comfortable being the insurance sellers and are paying to close those trades, a clear sign they see an increasing risk of a significant downside break.
Option Chain Support and Resistance:
-
Resistance: A formidable supply wall has been built by the heavy Call writing, with major resistance now at 26300 and 26400.
-
Support: The Max Pain level at 26200 acts as the first line of defense. Below that, the next significant Put wall is at 26100.
Conclusion: While retail is betting on stability, the FIIs are actively removing their downside support. This is a major red flag, suggesting the market is far more vulnerable than it appears. The risk is heavily skewed to the downside.
For Positional Traders, The Nifty Futures’ Trend Change Level is At 26409 . Going Long Or Short Above Or Below This Level Can Help Them Stay On The Same Side As Institutions, With A Higher Risk-reward Ratio. Intraday Traders Can Keep An Eye On 26265 , Which Acts As An Intraday Trend Change Level.
Nifty Intraday Trading Levels
Buy Above 26225 Tgt 26270, 26300 and 26350 ( Nifty Spot Levels)
Sell Below 26185 Tgt 26144, 26108 and 26066 (Nifty Spot Levels)
Wishing you good health and trading success as always.As always, prioritize your health and trade with caution.
As always, it’s essential to closely monitor market movements and make informed decisions based on a well-thought-out trading plan and risk management strategy. Market conditions can change rapidly, and it’s crucial to be adaptable and cautious in your approach.
► Join Youtube channel : Click here
► Check out Gann Course Details: W.D. Gann Trading Strategies
► Check out Financial Astrology Course Details: Trading Using Financial Astrology
► Check out Gann Astro Indicators Details: Gann Astro Indicators