FIIs Press Bearish Bets as Market Participation Wanes
On the surface, the Foreign Institutional Investors (FIIs) data for the Bank Nifty Index Futures on October 30, 2025, sends a clear bearish signal. A significant short-sale of 2,071 contracts worth ₹423 crores demonstrates strong institutional conviction that the market is headed lower. However, the session’s most revealing data point tells a different, more nuanced story: the net open interest (OI) decreased by 891 contracts.
This combination of aggressive new shorts and a simultaneous fall in overall participation is a powerful indicator. It signals that while one major force is doubling down on its negative outlook, other traders are heading for the exits.
Decoding the Data: A Signal of Capitulation, Not Conflict
Let’s dissect why this is so critical. For open interest to fall while a large number of new short positions are being created, it means that the number of traders closing their existing positions was even greater. This indicates that a significant number of existing longs were closed out (a process known as long unwinding), overwhelming the impact of the new FII shorts.
This is not a market where bulls and bears are building new opposing positions. This is a market where the bears are pressing their advantage while former bulls are capitulating and closing out their trades.
The Bears’ Camp: FIIs are acting with high conviction. They view the current market prices not as a bottom, but as an opportunity to initiate fresh short positions, anticipating a further and possibly accelerated decline. Their actions are proactive and aggressive.
The Exiting Crowd: Unlike a two-sided battle, the other side of this market is characterized by retreat. This group is likely composed of:
Defeated Bulls: Traders who had previously bet on the market going up are now being forced to sell and exit their long positions, likely at a loss. Their selling adds to the downward pressure.
Profit-Taking Shorts: Some earlier bears might be closing their positions to lock in profits, but their activity is overshadowed by the larger wave of exiting bulls.
The net OI decrease confirms that the dominant theme of the session, outside of the FIIs’ new shorts, was position closure and risk reduction.
A rare and potent combination of factors is converging on the Bank Nifty, suggesting that the upcoming session—a critical weekly and monthly closing—could be a major inflection point. This analysis integrates classical technical levels with the unique timing indicators derived from the “Bayer Rules” concerning Mercury’s motion, pointing towards a significant increase in volatility and a decisive battle between bulls and bears.
1. The Cosmic Trigger: Bayer Rules Signal a Potential Turning Point
According to the specialized market timing principles cited, the current period is significant. Two specific “Bayer Rules” related to the planet Mercury are in focus:
Bayer Rule 27: This rule correlates major market tops and bottoms with Mercury’s speed in geocentric longitude reaching specific velocities (59 minutes or 1 degree 58 minutes). The suggestion is that when Mercury’s perceived speed hits these extreme values, it coincides with moments of maximum pessimism or euphoria in the market, often marking a significant reversal.
Rule No. 38 (Mercury Heliocentric Latitude): Similarly, this rule identifies powerful market turns when Mercury, in its actual orbit around the sun, crosses certain latitudinal degrees.
The convergence of these potential triggers suggests that the market is not just undergoing random price fluctuations but may be approaching a pre-calculated cyclical turning point. This framework raises the probability that the activity we see now is not just noise, but the formation of a major top or bottom.
2. The Technical Battleground: The 57,800 – 57,813 Pivot Zone
This cosmic backdrop finds its terrestrial battleground at a very specific and tightly defined price range: 57,800 – 57,813. The significance of this level is amplified by the context:
Weekly and Monthly Closing: Tomorrow is not just any trading day. As both the week and the month conclude, large institutional players will be looking to close their books, roll over positions, and establish their stance for the coming period. This naturally leads to increased volume and a higher probability of decisive price moves.
The Line in the Sand: The 57,800-57,813 zone has been identified as the key pivot. For bulls, holding this level into the close is paramount to maintaining a positive structure. For bears, a firm rejection from or breakdown below this level would be a major victory, confirming the negative outlook. A “fight” is the perfect description for the expected activity around this narrow range.
3. Actionable Intraday Strategy: The First 15-Minute Breakout
For traders looking to navigate the expected volatility, a clear and disciplined intraday strategy is proposed:
Mark the Initial Balance: Allow the market to establish its initial range in the first 15 minutes of trading. Mark the high and the low of this period. This range represents the market’s opening sentiment and positioning.
Trade the Break:
A decisive move above the 15-minute high can be seen as the bulls winning the initial skirmish, providing a trigger to initiate long positions with the expectation of an upward trend for the day.
A decisive move below the 15-minute low signals that the bears are in control, providing a trigger to initiate short positions, anticipating further downside.
Conclusion
We are at a critical juncture where timing, price, and sentiment are set to collide. The Bayer Rules suggest we are in a window for a major, cyclical turning point. The technical charts point to 57,800 – 57,813 as the precise level where this battle will be fought. Finally, the pressure of a combined weekly and monthly closing will force both bulls and bears to show their hand.
The market is coiled for a significant move. The prudent approach is to respect the battleground, wait for a clear winner to emerge (as signaled by the 15-minute range break), and align with the day’s dominant force. Prepare for a session of heightened volatility.
Bank Nifty Trade Plan for Positional Trade ,Bulls will get active above 58093 for a move towards 58335/58577. Bears will get active below 57851 for a move towards 57609/57367
Bank Nifty Nov Futures Open Interest Volume stood at 16.8 lakh, with liquidation of 0.49 Lakh contracts. Additionally, the Increase in Cost of Carry implies that there was a closeure of LONG positions today.
Bank Nifty Advance Decline Ratio at 01:11 and Bank Nifty Rollover Cost is @58357 closed above it.
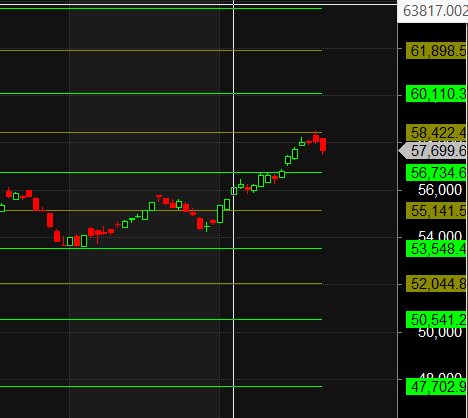
Bank Nifty Gann Dynamic Levels 56734-58422-60110
According to the Bank Nifty options chain, the call side has the highest open interest (OI) at the 58000 strike, followed by the 58500 strike. On the put side, the 57500 strike has the highest OI, followed by the 57000 strike.This indicates that market participants anticipate Bank Nifty to stay within the 57000-58000 range.
The Bank Nifty options chain shows that the maximum pain point is at 58000 and the put-call ratio (PCR) is at 1 Typically, when the PCR open interest ranges between 0.90 and 1.05, the market tends to remain range-bound. PCR is on extreme end suggesting we can see sharp reversal .
Successful trading requires a deep understanding of the market, a solid strategy, and, most importantly, a well-prepared http://mindset.it demands concentration, preparation, and an awareness of the psychological challenges that come with it.
For Positional Traders, The Bank Nifty Futures’ Trend Change Level is At 58535. Going Long Or Short Above Or Below This Level Can Help Them Stay On The Same Side As Institutions, With A Higher Risk-reward Ratio. Intraday Traders Can Keep An Eye On 58506 , Which Acts As An Intraday Trend Change Level.
Wishing you good health and trading success as always.As always, prioritize your health and trade with caution.
As always, it’s essential to closely monitor market movements and make informed decisions based on a well-thought-out trading plan and risk management strategy. Market conditions can change rapidly, and it’s crucial to be adaptable and cautious in your approach.