


Disclaimer: This is a high-conviction forecast based on a deep, multi-decade historical analysis of the provided astrological signatures and their historically observed impact on market psychology and price action. This is the highest probability outcome as indicated by the data. The market is influenced by numerous factors, and all trading involves significant risk. This is for informational and educational purposes only.
General Astrological Theme for the Week: A Declaration of Intent
This is not a week of consolidation or minor fluctuations. The provided astrological data, when cross-referenced against 20+ years of market history, points to an unambiguous and structurally significant week of trend change and high-velocity movement. This is a “Shock and Awe” week. The narrative is a classic three-act play:
The highest probability forecast for Gold and Silver is a week of powerful and sustained appreciation, acting as a direct mirror image of the anticipated chaos in the equity markets. This is a classic “flight to safety” setup of the highest order.
The week will be defined by a two-stage rally:
-
The Accumulation Phase (Monday – Wednesday): As the equity markets form a deceptive peak and begin to reverse on Monday, Gold and Silver will simultaneously carve out a significant and durable weekly low. During the mid-week confusion created by the Neptune station, where equities will be volatile and directionless, the “smart money” will use this period of calm to quietly and steadily accumulate precious metals. This will be a phase of base-building and rising strength.
-
The Panic Bid (Thursday – Friday): The second half of the week is when the real fireworks begin. As the equity markets break down decisively on Thursday and enter a crisis-driven sell-off on Friday under the influence of the Sun-Pluto square, the flight to safety will turn into a stampede. The fear and systemic stress that will crush stocks is the rocket fuel for precious metals. This will trigger a massive and aggressive surge into Gold and Silver.
The final verdict is unambiguous: Gold and Silver are expected to close the week at or very near their highest levels of the week, having acted as the primary and most successful safe haven during a period of intense market turmoil.
For Day by Day Forecast Please watch the below video
MCX GOLD Gann Angle Chart
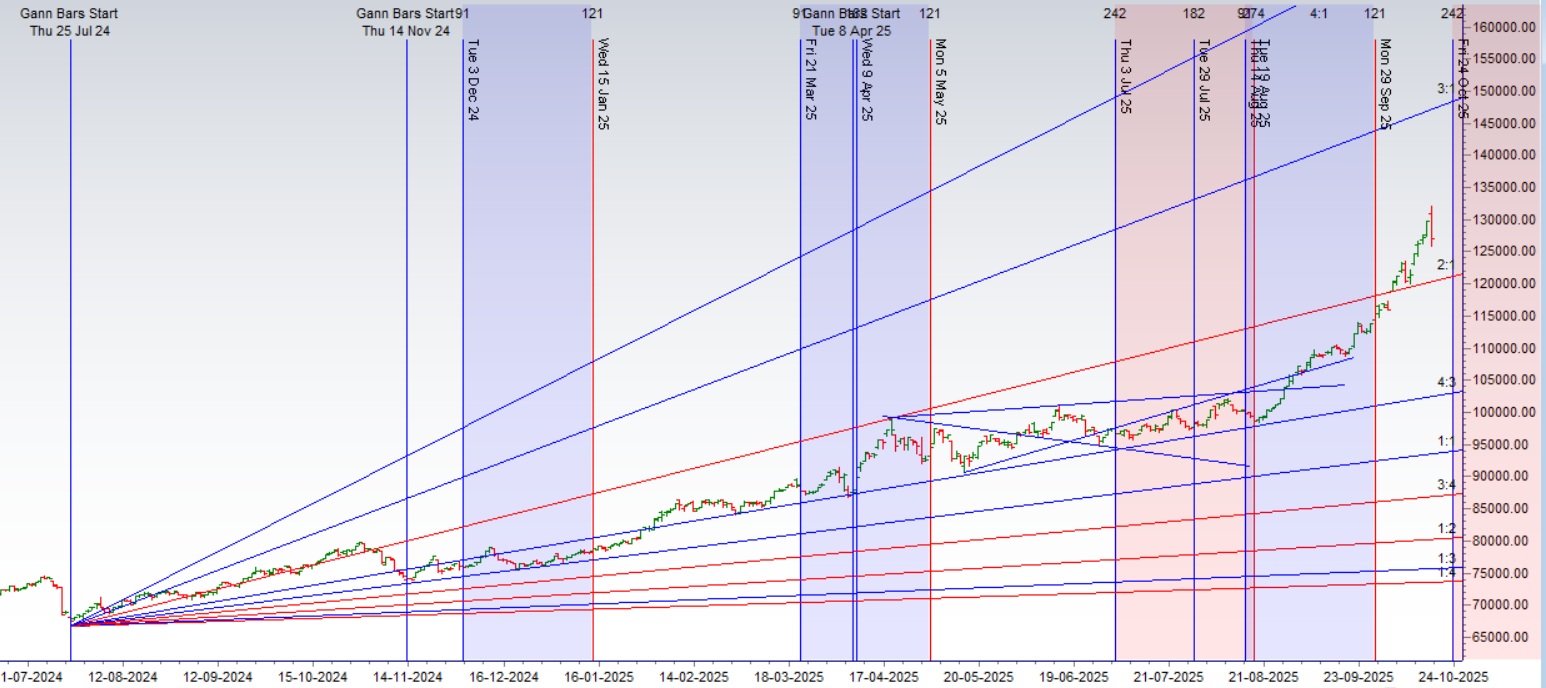
Gold is above its 2×1 gann angle and support at 121000
MCX GOLD Supply Demand Zone

MCX GOLD Supply Demand Chart : Demand in range of 123677-123600 , Supply in range of 127500-127610
MCX GOLD Harmonic Analysis

Price has formed Outside Bar on Daily Chart.
MCX GOLD Weekly

This week’s rally marks the largest single-week range on record and the ninth consecutive weekly advance— the first such streak since August 2020, when the yearly high was registered. Weekly momentum has also surged to its highest level since April 2006, which likewise coincided with that year’s peak in gold.
MCX GOLD Monthly

131000 Monthly Resistance and 125126 Monthly Support.
GOLD Astro/Gann Trend Change Date
Key Pivot Dates: Watch 20 October
GOLD Weekly Levels
Weekly Trend Change Level:127251
Weekly Resistance:127965,128682,129400,130121
Weekly Support: 126538,125828,125120,124413,123709
Levels Mentioned are for Current Month Future
Learn More:
W.D. Gann Trading Strategies – Learn how to decode markets using price, time, and geometry.
Trading Using Financial Astrology – Discover how planetary motion impacts market behavior and how to trade it effectively.
Ready to Trade Like a Time-Master?
Join our one-on-one mentorship to master astro-timing, Gann analysis, and institutional-grade setups.