


FIIs Unleash Fresh Shorts as Nifty Cracks: A Bearish Conviction Play
While the market may have appeared stable on the surface, the undercurrents of the Nifty Index Futures on August 22nd told a story of deepening conviction and a widening divide between institutional and retail players.
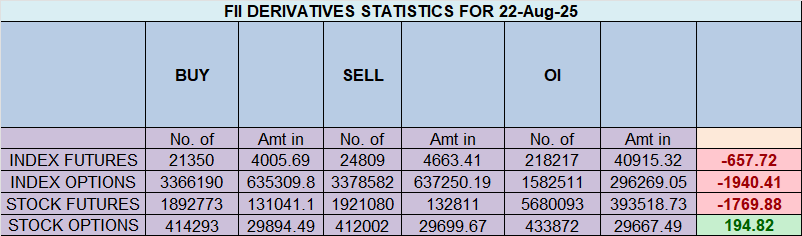
Foreign Institutional Investors (FIIs) made their stance unequivocally clear, net shorting the index by 2,280 contracts worth ₹433 crore. But the real headline is hidden in the Open Interest data: OI increased by a significant 4,614 contracts.
This combination—Net Selling with a Rise in Open Interest—is one of the most powerful signals in F&O analysis. It means we are not seeing profit-taking; we are witnessing the creation of aggressive, new bearish bets.
Let’s dissect the data to understand the battle lines being drawn.
The Big Picture: The “Smart Money vs. Retail” Divide Deepens
First, let’s set the stage with the overall positioning, which is critical for context:
-
FII Positioning: Their Long-to-Short Ratio is 0.12 (or 10:90). This is an extremely bearish stance, indicating that for every one bullish bet, they hold nearly nine bearish ones.
-
Client (Retail) Positioning: Their Long-to-Short Ratio is 2.35 (or 70:30). This is the polar opposite—overwhelmingly bullish.
This stark contrast shows that FIIs and retail traders are on completely opposite sides of the trade. The activity on August 22nd only served to reinforce these positions.
The Action Breakdown: A Tale of Two Tapes
The detailed data reveals exactly who was doing what:
FII Activity (Building Shorts with Conviction):
-
New Longs Added: 1,129 contracts
-
New Shorts Added: 4,588 contracts
The FIIs didn’t just sell; they aggressively initiated new short positions. The fact that they added four times more new shorts than longs is a clear signal of their bearish conviction. They believe the market is headed lower and are putting fresh capital to work based on that belief.
Client Activity (Buying the Dip with Optimism):
-
New Longs Added: 6,385 contracts
-
New Shorts Added: 777 contracts
Retail traders saw the day’s price action as a buying opportunity. They absorbed the supply from the FIIs and then some, adding a massive number of new long positions. They remain confident that the market is heading higher.
Market Interpretation: What This Means for Traders
This is not a complicated signal. It is a clear and direct warning.
-
This is Aggressive Bearish Positioning: Unlike previous sessions which saw some short covering, this move is about fresh short building. This is a far more potent bearish signal. FIIs are not just closing old bets; they are initiating new ones with conviction.
-
The Rally is on Retail’s Shoulders: The market is currently being held up by the strong buying interest from the retail segment. They are effectively absorbing all the selling pressure from the institutions. The crucial question is: how long can they sustain it?
-
A Powder Keg for Volatility: When institutional smart money and the retail crowd take such extreme, opposing views, it creates a recipe for high volatility. The market is coiled like a spring. A breakout in either direction is likely to be sharp and fierce as one side is eventually forced to capitulate.
Final Takeaway: Don’t be fooled by price action that seems resilient. The underlying data shows that the “smart money” is actively betting against this market with fresh positions. While retail’s buying power can keep the market afloat in the short term, the growing bearish stance of FIIs is a significant red flag.
Until we see FIIs stop adding new shorts and start covering their massive existing positions, any rally should be viewed with extreme caution. The battle lines are drawn, and the institutions have just reinforced their bearish camp.
The Promotion and Regulation of Online Gaming Bill, 2025: Building a Safe and Innovative Digital Bharat
Last Analysis can be read here
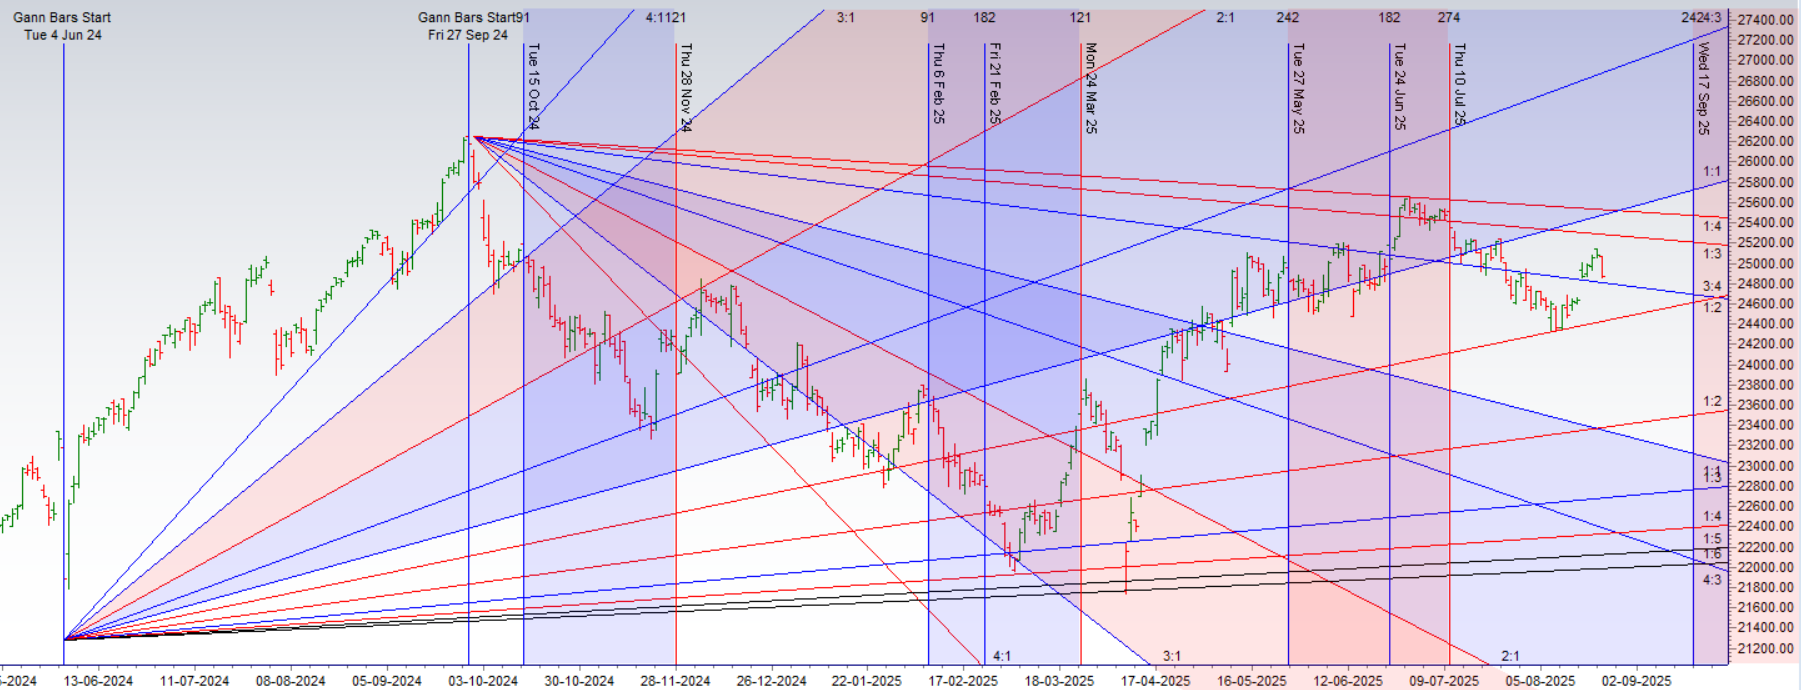
Nifty’s Perfect Storm: Harmonic Rejection Meets Fed Surprise on a Critical Gann Day
The charts don’t lie. As we highlighted in our last analysis, the Nifty was approaching a critical crossroads of Price and Time. The result was a dramatic fall, a textbook rejection from the harmonic musical octave level, proving once again the power of these hidden market structures.
This sharp decline wasn’t just a random event; it unfolded precisely on the day of our anticipated astro-Gann cluster: a New Moon, a Sun Ingress, and a Gann Natural Date. This powerful convergence of time-based cycles acted as the catalyst, turning the harmonic resistance into a springboard for the bears.
But just as the bears began to celebrate, the global narrative took a sharp, unexpected turn.
The Twist: The Fed Signals a Rate Cut
Overnight, the US Federal Reserve, speaking from the Jackson Hole symposium, delivered the one thing markets have been craving: a clear signal towards future rate cuts. This dovish pivot immediately ignited a powerful rally in US markets, flooding the global financial system with bullish sentiment.
This has created a classic and fascinating dilemma for the Indian market as we head into a volatile expiry week:
-
The Bear Case: Our own market’s technical structure is weak. We have a confirmed rejection from a major resistance level on a key Gann date. The immediate trend is down.
-
The Bull Case: The global environment has turned decisively positive. A dovish Fed is a massive tailwind for equities worldwide, and it’s difficult for any market to fight that powerful a tide for long.
The Next Hurdle: The Tariff Overhang
Adding another layer of complexity, a significant known risk is still on the horizon. The planned implementation of new tariffs is scheduled for August 27th, a date which itself is surrounded by another cluster of astrological triggers. This acts as a dampener on bullish enthusiasm, reminding traders that geopolitical risks have not disappeared.
Navigating the Chaos: A Strategy for the Expiry Week
So, how do we trade a market caught between a bearish technical breakdown and a bullish global catalyst? We let the market itself tell us what to do. The opening price action will be our guide.
For Intraday Traders: The First 15 Minutes are Everything
In a situation this fluid, the initial sentiment is key. The “money flow” in the first 15 minutes of trading will reveal which force is stronger—the local sellers responding to the technical breakdown, or the global buyers inspired by the Fed.
-
A decisive break above the first 15-minute high could signal that the global tailwind is winning, potentially triggering a short-covering rally.
-
A decisive break below the first 15-minute low would suggest that the bearish technical pressure is overwhelming the positive news, and the downtrend is likely to continue.
For Positional Traders: The End-of-Day Verdict
For those with a longer timeframe, it’s crucial to avoid the intraday noise. The market’s true verdict will be delivered at the closing bell.
-
The End-of-Day High and Low will become your new reference points.
-
A close above the day’s high would be a strong signal that the market has absorbed the selling pressure and is ready to follow the global rally.
-
Conversely, a close below the day’s low would confirm the bears are still in complete control, and the rejection from the harmonic level remains the dominant theme.
Conclusion: The market has given us a puzzle. The technicals and timing pointed down and delivered. The global news points up. With the added volatility of expiry week and the looming tariff deadline, this is a time for discipline, not dogma. Watch the levels, respect the price action, and let the market show its hand before you commit.
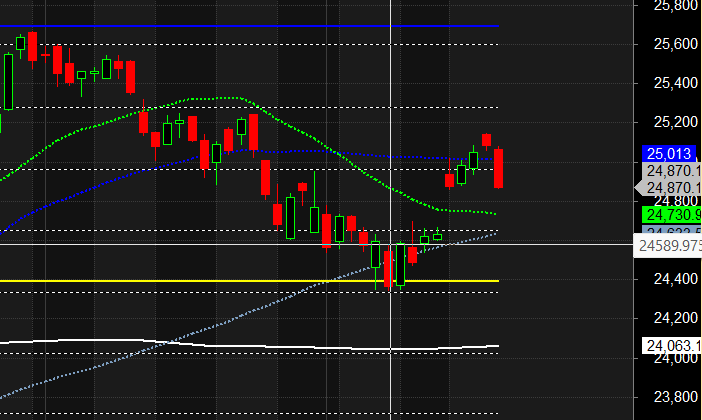
Nifty Trade Plan for Positional Trade ,Bulls will get active above 25013 for a move towards 25091/25055. Bears will get active below 24934 for a move towards 24856/24778
Traders may watch out for potential intraday reversals at 09:33,10:26,11:31,12:39,02:09 How to Find and Trade Intraday Reversal Times
Nifty Aug Futures Open Interest Volume stood at 1.49 lakh cr , witnessing liquidation of 8.9 Lakh contracts. Additionally, the increase in Cost of Carry implies that there was covering of SHORT positions today.
Nifty Advance Decline Ratio at 07:42 and Nifty Rollover Cost is @24887 closed below it.
Nifty Gann Monthly Buy Level : 24887
Nifty Gann Monthly Sell Level : 24582
Nifty has closed below its 20 SMA @ 25012 Trend is Sell on Rise till below 25000
Nifty options chain shows that the maximum pain point is at 25000 and the put-call ratio (PCR) is at 0.61 .Typically, when the PCR open interest ranges between 0.90 and 1.05, the market tends to remain range-bound.
In the cash segment, Foreign Institutional Investors (FII) sold 1622 cr , while Domestic Institutional Investors (DII) sold 329 cr.
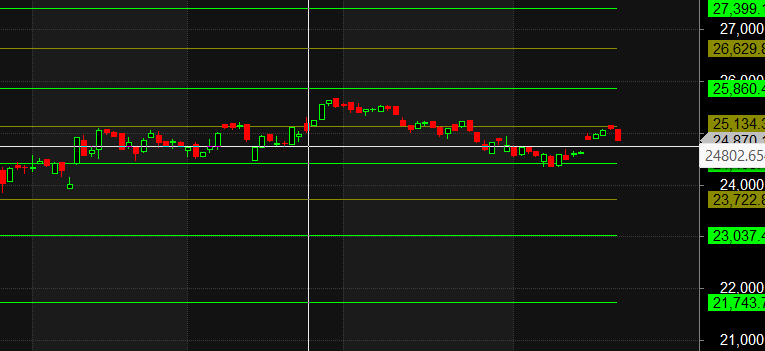
Traders who follow the musical octave trading path may find valuable insights in predicting Nifty’s movements. According to this path, Nifty may follow a path of 23037-23722-24408-25134-25860 This means that traders can take a position and potentially ride the move as Nifty moves through these levels.Of course, it’s important to keep in mind that trading is inherently risky and market movements can be unpredictable.
the most profitable traders will tell you that the true mastery lies not in understanding the market, but in understanding yourself.
For Positional Traders, The Nifty Futures’ Trend Change Level is At 24782 . Going Long Or Short Above Or Below This Level Can Help Them Stay On The Same Side As Institutions, With A Higher Risk-reward Ratio. Intraday Traders Can Keep An Eye On 24956, Which Acts As An Intraday Trend Change Level.
Nifty Intraday Trading Levels
Buy Above 24972 Tgt 25016, 25066 and 25108 ( Nifty Spot Levels)
Sell Below 24938 Tgt 24904, 24850 and 24808 (Nifty Spot Levels)
Wishing you good health and trading success as always.As always, prioritize your health and trade with caution.
As always, it’s essential to closely monitor market movements and make informed decisions based on a well-thought-out trading plan and risk management strategy. Market conditions can change rapidly, and it’s crucial to be adaptable and cautious in your approach.
► Join Youtube channel : Click here
► Check out Gann Course Details: W.D. Gann Trading Strategies
► Check out Financial Astrology Course Details: Trading Using Financial Astrology
► Check out Gann Astro Indicators Details: Gann Astro Indicators