


FIIs Buy Nifty for ₹861 Crore, But Are They Turning Bullish? The Data Says No.
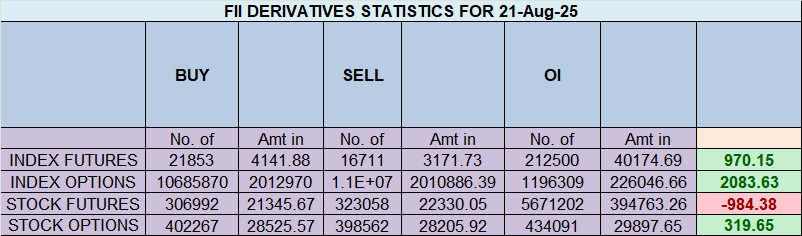
On August 21st, the headline data for Nifty Index Futures seemed to send a clear bullish signal. Foreign Institutional Investors (FIIs) emerged as powerful net buyers, snapping up 4,591 contracts worth a hefty ₹861 crore.
But for traders who look beyond the surface, this is where the story gets interesting. Despite this aggressive buying, the net open interest (OI) paradoxically fell by 3,513 contracts. Furthermore, a look at the FIIs’ overall positioning reveals a shockingly bearish stance.
So, what’s really going on? Let’s dissect the data to uncover the market’s true message.
The Big Picture: A Market Deeply Divided
Before we even get to the day’s activity, let’s look at the current positioning. This context is everything.
-
FII Positioning: Long-to-Short Ratio is a mere 0.11. This means for every 1 long contract they hold, they are holding nearly 9 short contracts. This is an overwhelmingly bearish stance.
-
Client (Retail) Positioning: Long-to-Short Ratio is 2.29. This is the mirror opposite. Retail traders are heavily long, holding more than 2 long contracts for every 1 short.
This is the classic “Smart Money vs. Retail” setup. The FIIs are betting heavily on a downside, while retail traders are positioned for a continued rally. This underlying tension is the key to understanding the day’s events.
Decoding the FII “Buy” Signal: It’s Not What You Think
With FIIs being so bearish overall, their massive “buy” figure for the day wasn’t a change of heart. It was a tactical retreat. Here’s the breakdown:
-
New Longs Added: 842 contracts
-
Shorts Covered (Closed): 4,300 contracts
The story is crystal clear. The buying activity was overwhelmingly dominated by Short Covering. FIIs who had bet against the Nifty were forced to buy back their positions, likely due to the market moving against them or hitting a pre-defined stop-loss level. Their new bullish bets were minimal in comparison.
This is not a sign of bullish conviction. It’s a sign of bears feeling the pressure. This is defensive buying, not offensive buying.
What Were Clients Doing? Cashing In.
While FIIs were busy covering their shorts, the heavily long retail segment was doing the exact opposite.
-
Longs Covered (Closed): 5,568 contracts
Clients were the primary sellers. They were engaging in Long Unwinding, likely booking profits as the market rose. In essence, retail traders were selling their long positions to the FIIs who needed to buy them back to close their shorts. This is a classic transfer of positions at a potential resistance zone.
The Market Interpretation: A Rally on Weak Knees
Putting it all together, here’s what this data tells us about the current market structure:
-
Fuel for the Rally was Short Covering: The day’s upward momentum was not driven by fresh, confident money entering the market. It was fueled by bearish traders exiting their losing positions. Rallies built on short covering can be powerful but are often short-lived unless new buyers step in.
-
FIIs Remain Dangerously Bearish: Don’t let the one-day buy figure fool you. With a 0.11 long-short ratio, the “smart money” is still positioned for a significant correction. They have merely trimmed their most aggressive short bets.
-
Profit-Taking at Higher Levels: The fact that clients are selling their longs into this rally indicates that they perceive this as a good level to take profits, suggesting a potential resistance area.
Final Takeaway: The market is at a critical juncture. The recent rally has squeezed the bears, but it hasn’t convinced them to turn bullish. The underlying structure remains fragile, with FIIs still holding a massive short position.
For the market to sustain its upward trend, we need to see FIIs do two things: continue to cover their shorts and start building significant new long positions (i.e., we need to see Net Buying with a rise in Open Interest). Until that happens, this rally is running on borrowed time, and traders should remain extremely cautious of a reversal.
The Promotion and Regulation of Online Gaming Bill, 2025: Building a Safe and Innovative Digital Bharat
Last Analysis can be read here
Nifty Hits a Harmonic Wall: Why Monday Could See a Major Market Move
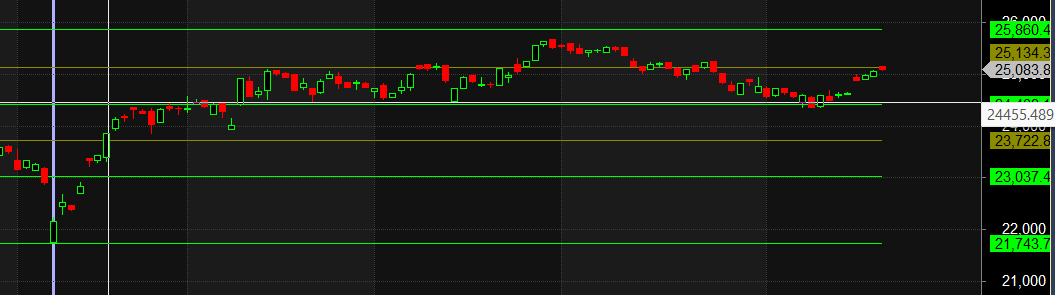
After a blistering six-day rally, the Nifty has finally paused, and it’s not by accident. The index has run into a formidable and rather esoteric level of resistance: 25134, a key “Musical Octave” level. This isn’t just another line on the chart; it’s a point of harmonic resonance where the market’s energy is known to shift.
But this is more than just a technical story. We are standing at the confluence of three powerful forces—Price, Time, and News—creating a perfect setup for a significant, trend-defining move on Monday.
Let’s break down the three critical elements that every trader needs to watch.
1. The Price Barrier: The “Musical Octave” at 25134
For traders who use advanced cycle analysis, Musical Octaves are harmonic levels derived from key market pivots. Think of them as the natural “notes” in the market’s symphony. When the price reaches one of these harmonic levels after a strong trend, it often acts as a powerful point of equilibrium, leading to a pause, a consolidation, or an outright reversal.
The Nifty’s struggle at 25134 after a six-day winning streak is a textbook example. The rally’s momentum is being tested at a point of natural harmonic resistance. Bulls need to prove they can break through this “sound barrier” to continue the melody higher.
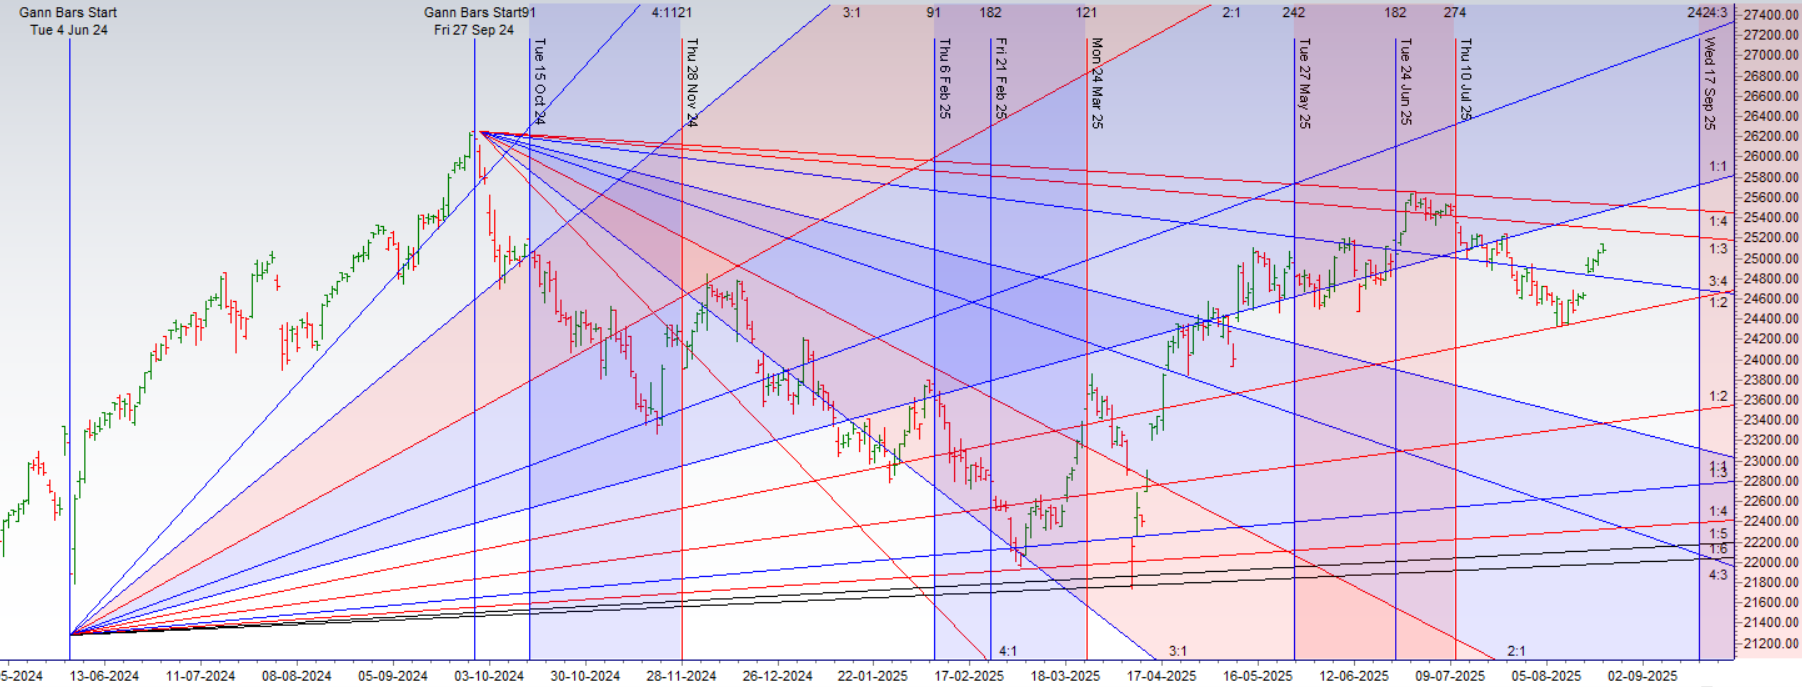
2. The Time Trigger: A Critical Gann & Astro Weekend
What makes the 25134 resistance so potent is its timing. The market is not just hitting a key price; it’s doing so at a key time. This weekend is loaded with cyclical significance for followers of W.D. Gann’s methods:
-
Gann Natural Date: These are specific, pre-calculated dates in the calendar that have a high probability of marking market turning points. A Gann date aligning with a major resistance level is a high-alert signal.
-
Sun Sign Change (Sun Ingress): The Sun’s movement into a new zodiac sign is a key event in financial astrology, often correlating with a shift in collective market psychology and sentiment.
When a crucial price level is tested during a powerful time window like this, the odds of a major reaction increase dramatically. The market’s “price-time square out” is in effect, signaling that a period of equilibrium is ending and a new directional impulse is imminent.
3. The News Catalyst: The Jackson Hole Speech
As if the technical and time factors weren’t enough, the entire global market is hanging on every word from the US Federal Reserve. This evening, the Fed will speak at the highly anticipated Jackson Hole Economic Symposium.
This event is the fundamental trigger that could ignite the “big move” everyone is expecting. The market is desperate for clues on inflation and the future path of interest rates.
-
A hawkish (aggressive) tone could send shockwaves through the market, validating the resistance at 25134 and potentially triggering a sharp correction.
-
A dovish (accommodative) tone could provide the fuel needed for bulls to shatter the resistance and launch the next leg of the rally.
Putting It All Together: Get Ready for Monday
This is the ultimate trading setup. We have a trifecta of powerful, independent variables all converging at the same point:
-
PRICE: Strong harmonic resistance at 25134.
-
TIME: A potent weekend with a Gann Date and Sun Ingress.
-
NEWS: A market-moving speech from the world’s most powerful central bank.
Holding large overnight positions through this weekend is a high-stakes gamble. The smartest play is to step back, observe, and prepare. Monday’s opening will likely be explosive. The key is to wait for the market’s verdict: will it be a decisive breakout above 25134 or a sharp rejection from this harmonic wall?
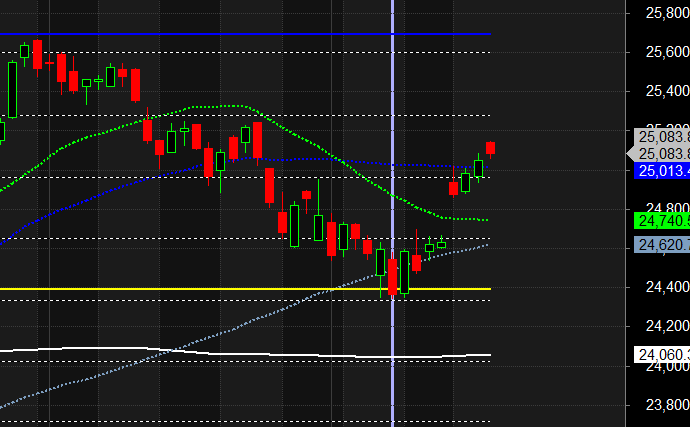
Nifty Trade Plan for Positional Trade ,Bulls will get active above 25013 for a move towards 25091/25055. Bears will get active below 24934 for a move towards 24856/24778
Traders may watch out for potential intraday reversals at 09:43,10:22,11:56,12:39,02:41 How to Find and Trade Intraday Reversal Times
Nifty Aug Futures Open Interest Volume stood at 1.49 lakh cr , witnessing liquidation of 8.9 Lakh contracts. Additionally, the increase in Cost of Carry implies that there was covering of SHORT positions today.
Nifty Advance Decline Ratio at 22:28 and Nifty Rollover Cost is @24887 closed below it.
Nifty Gann Monthly Buy Level : 24887
Nifty Gann Monthly Sell Level : 24582
Nifty has closed below its 20 SMA @ 25012 Trend is Buy on dips till above 25000
Nifty options chain shows that the maximum pain point is at 25050 and the put-call ratio (PCR) is at 1 .Typically, when the PCR open interest ranges between 0.90 and 1.05, the market tends to remain range-bound.
In the cash segment, Foreign Institutional Investors (FII) bought 1246 cr , while Domestic Institutional Investors (DII) bought 2546 cr.
Traders who follow the musical octave trading path may find valuable insights in predicting Nifty’s movements. According to this path, Nifty may follow a path of 23037-23722-24408-25134-25860 This means that traders can take a position and potentially ride the move as Nifty moves through these levels.Of course, it’s important to keep in mind that trading is inherently risky and market movements can be unpredictable.
If you condition your mind to lose without anxiety without emotional attachment and without desire to get even.. Things will start turning around for you..
For Positional Traders, The Nifty Futures’ Trend Change Level is At 24744 . Going Long Or Short Above Or Below This Level Can Help Them Stay On The Same Side As Institutions, With A Higher Risk-reward Ratio. Intraday Traders Can Keep An Eye On 25041, Which Acts As An Intraday Trend Change Level.
Nifty Intraday Trading Levels
Buy Above 25055 Tgt 25099, 25136 and 25180 ( Nifty Spot Levels)
Sell Below 25012 Tgt 24865, 24824 and 24777 (Nifty Spot Levels)
Wishing you good health and trading success as always.As always, prioritize your health and trade with caution.
As always, it’s essential to closely monitor market movements and make informed decisions based on a well-thought-out trading plan and risk management strategy. Market conditions can change rapidly, and it’s crucial to be adaptable and cautious in your approach.
► Join Youtube channel : Click here
► Check out Gann Course Details: W.D. Gann Trading Strategies
► Check out Financial Astrology Course Details: Trading Using Financial Astrology
► Check out Gann Astro Indicators Details: Gann Astro Indicators