


Market Insight: Decoding the Tug-of-War Between FIIs and Retail
Executive Summary:
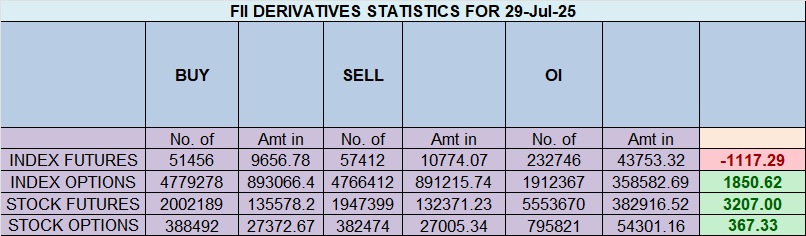
The data from July 29 paints a picture of extreme divergence and high conviction between the two most significant market participants. Foreign Institutional Investors (FIIs) have adopted a deeply bearish stance, positioning themselves for a potential market downturn with an alarming 15:85 long-to-short ratio. In stark contrast, Retail clients are overwhelmingly bullish, holding a 70:30 long-to-short ratio.
This classic “Smart Money vs. Retail” standoff is a major red flag. While FIIs are actively adding new short positions, retail traders are covering their old shorts and maintaining their long positions. The decrease in overall Open Interest, driven by massive short covering from clients, adds a layer of complexity, suggesting that while old bearish positions are being closed, new, more powerful bearish positions are being initiated by institutional players. The market is now precariously balanced, and the resolution of this conflict will likely dictate the next significant trend.
1. Detailed FII (Foreign Institutional Investors) Activity Analysis
The actions of FIIs, often referred to as “Smart Money,” provide the most critical insight into institutional expectations. Their behavior on this day was unequivocally bearish.
-
Adding New Shorts (High Conviction Bearishness): FIIs added 3,001 new short contracts. This is an active, aggressive bet that the market will decline. They are not merely hedging; they are initiating new positions to profit from a fall.
-
Closing Longs (Abandoning Bullish Bets): Simultaneously, they covered 2,955 long contracts. This action shows a lack of faith in any potential upside. By closing their long positions, they are removing their “safety net” and signaling that they do not expect the market to rally.
Interpretation of FII Behavior:
The combination of adding new shorts while closing existing longs is a powerful bearish signal. It indicates a strategic shift in their market view. They are not just neutral; they are actively positioning for a downward move. The resulting Long/Short Ratio of 15:85 (or 0.15) is at an extreme level. This means for every 1 contract FIIs are holding for a potential upside, they are holding nearly 6 contracts betting on a downside. This level of directional conviction from FIIs is rare and should be treated as a significant warning for bulls.
2. Detailed Client (Retail) Activity Analysis
The Client category, largely representing retail traders, displayed behavior that was the mirror opposite of the FIIs.
-
Massive Short Covering (Belief the Bottom is In): Clients covered a staggering 6,504 short contracts. This is the single largest activity in the provided data. It implies that retail traders who were previously bearish are now rushing to close their positions. This could be due to taking small profits, cutting losses on a minor bounce, or a genuine belief that the market has bottomed out and will now rally.
-
Minimal Long Covering: They only covered 2,090 long contracts, showing a reluctance to let go of their bullish bets.
Interpretation of Client Behavior:
The massive short covering, combined with their overall positioning, reveals a strongly bullish sentiment among retail participants. Their Long/Short Ratio of 70:30 (or 2.46) indicates extreme optimism. They are effectively “buying the dip” and betting against the institutional sentiment. Historically, when retail sentiment reaches such bullish extremes in direct opposition to FIIs, it often precedes a market correction, as the retail segment is left holding positions while the market moves in the direction anticipated by the institutions.
3. The Critical Clue: The Decrease in Open Interest (OI)
At first glance, one might expect Open Interest to increase given that FIIs added new shorts. However, the net OI decreased by 1,089 contracts. This is a crucial piece of the puzzle.
-
What it means: A decrease in OI signifies that more positions were closed than were opened across the market.
-
Why it happened: The enormous short covering by clients (6,504 contracts closed) and long covering by both FIIs and clients (2,955 + 2,090 = 5,045 contracts closed) far outweighed the new shorts added by FIIs (3,001 contracts opened).
-
The Bearish Interpretation of Falling OI: This specific scenario is known as “Short Covering accompanied by Fresh Short Buildup.” It means that “weak hand” shorts (retail) are being forced or scared out of their positions, while “strong hands” (FIIs) are using the opportunity to build fresh short positions. This is a sophisticated bearish signal. The market is essentially clearing out old bearish positions to make way for a new, institutionally-led downward leg.
Market Outlook and Potential Scenarios
-
Primary Scenario (High Probability): Bearish Continuation. The extreme bearish positioning of FIIs is the dominant signal. The market is highly vulnerable to a sell-off. Any minor rally or attempt to move higher is likely to be met with aggressive selling by institutions, who may use such bounces to add to their short positions at more favorable prices. This is a classic setup for a “bull trap.”
-
Confirmation Signal to Watch: A decisive break below the day’s low or a key support level would validate the FIIs’ bearish stance. This could trigger stop-losses from the heavily long retail segment, leading to accelerated selling and market panic.
-
Contrarian Scenario (Low Probability): Short Squeeze. If the market, against all odds, manages to rally strongly and break significant resistance levels, the huge short position held by FIIs could be threatened. However, this is a very low-probability outcome. It would require a major positive catalyst to force institutions with such high conviction to abandon their positions.
Conclusion:
The data presents a clear and present danger for market bulls. The battle lines are drawn, with professional institutions betting heavily on a decline and retail traders positioned for a rally. History and experience suggest that the “Smart Money” is more often right at such critical junctures. The environment is ripe for increased volatility and a potential downside move. Traders should exercise extreme caution with long positions and view any upward price action with skepticism until there is clear evidence that FIIs have begun to cover their massive short exposure.
Overcoming Fear & Greed: The Trader’s Eternal Battle
Last Analysis can be read here
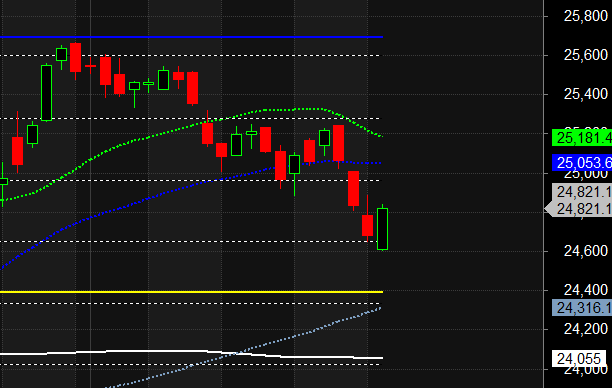
The Nifty staged a much-needed relief rally today, but the celebration was cut short as bulls failed to conquer the critical resistance level of 24888. This failure means the prevailing bearish market structure of “lower lows and lower highs” remains firmly intact. The market is now precariously poised, caught between a fragile recovery and a dominant downtrend. All eyes now turn to the US Federal Reserve’s policy outcome tonight, which will act as the ultimate arbiter, set to trigger a significant gap opening and dictate the market’s direction for the rest of the week.
1. The Technical Picture: A Rebound Without Conviction
After three consecutive days of selling pressure, today’s bounce provided a respite for the bulls. However, from a technical standpoint, the recovery lacked the strength needed to signal a genuine trend reversal.
-
The Unbroken Bearish Structure: The inability to close above 24888 is the most critical takeaway from today’s session. This level, likely a previous support-turned-resistance, acted as a firm ceiling. As long as the Nifty trades below this level, the downtrend remains the primary trend. Any rally is considered a “sell-on-rise” opportunity for bears.
-
A Potential “Dead-Cat Bounce”: Until the 24888 level is decisively reclaimed, today’s move risks being classified as a mere technical bounce within a larger downtrend—a “dead-cat bounce” where price temporarily recovers before resuming its decline.
2. The Volatility Catalysts: Chiron and the Fed
The market is being influenced by two powerful, distinct forces that guarantee heightened volatility.
-
Intraday Volatility (Chiron Retrograde): Today’s astrological event, the Chiron Retrograde, likely contributed to the session’s choppy and indecisive nature. Such events often correlate with periods where the market revisits “old wounds” or key inflection points, leading to erratic swings as bulls and bears battle for control without a clear winner—a perfect description of today’s failure at resistance.
-
Overnight Gap Risk (US Fed Policy): The main event is the US Fed’s policy decision tonight. This is a binary event that will have a direct and immediate impact on global risk sentiment.
-
Bullish Scenario (Dovish Fed): If the Fed signals a rate cut or adopts a significantly dovish tone, we can expect a gap-up opening tomorrow. This would provide the bulls with the momentum needed to re-challenge and potentially break through the 24888 resistance.
-
Bearish Scenario (Hawkish Fed): If the Fed’s statement is perceived as hawkish or less dovish than expected, it will likely trigger a risk-off move, leading to a gap-down opening. This would validate the bearish structure and could see the Nifty quickly resume its downward trajectory.
-
3. The Strategic Outlook: The Battle Plan for Bulls and Bears
The market’s next move is contingent on the interplay between the Fed’s decision and the 24888 level.
-
The Bullish Path: The mission for the bulls is clear and singular: Use a positive Fed outcome to gap up and decisively conquer 24888. A sustained move above this level would break the “lower high” pattern, signaling a potential short-term trend reversal and trapping the bears who shorted at resistance.
-
The Bearish Path: The bears currently have the advantage of the trend. Their strategy is simple: Defend 24888 at all costs. A hawkish Fed outcome would be their ideal trigger, leading to a gap down that would leave today’s buyers trapped. A subsequent break below today’s low would confirm the continuation of the downtrend, with new lows becoming the next logical target.
Conclusion:
Today’s recovery was a test, and the bulls failed at the first major hurdle. The market is sending a clear signal: the downtrend is still in force until proven otherwise. The fate of the market now rests entirely on the Federal Reserve. The 24888 level is the line in the sand. Tomorrow’s opening will reveal the verdict, and traders should be prepared for a significant, gap-driven move and the heightened volatility that will follow.
Nifty Trade Plan for Positional Trade ,Bulls will get active above 24912 for a move towards 24990/25069. Bears will get active below 24755 for a move towards 24677/24598
Traders may watch out for potential intraday reversals at 09:57,10:53,12:51,02:31 How to Find and Trade Intraday Reversal Times
Nifty July Futures Open Interest Volume stood at 12.3 lakh cr , witnessing liquidation of 3.9 Lakh contracts. Additionally, the increase in Cost of Carry implies that there was closure of SHORT positions today.
Nifty Advance Decline Ratio at 36:14 and Nifty Rollover Cost is @24321 closed above it.
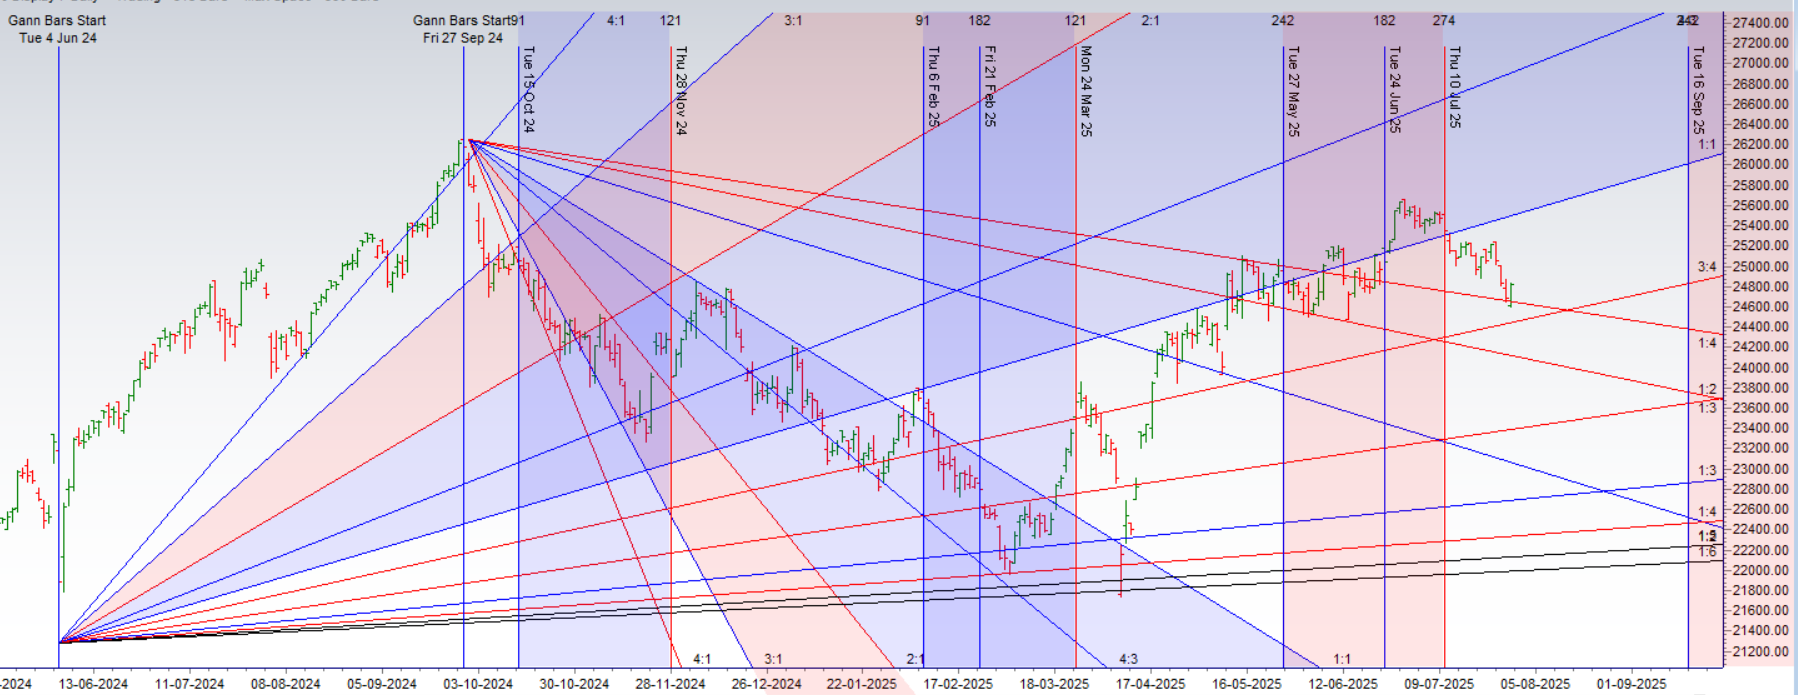
Nifty Gann Monthly Buy Level : 25709
Nifty Gann Monthly Sell Level : 25393
Nifty has closed below its 50 SMA @ 25035 Trend is Sell on Rise till below 25100
Nifty options chain shows that the maximum pain point is at 25100 and the put-call ratio (PCR) is at 0.70.Typically, when the PCR open interest ranges between 0.90 and 1.05, the market tends to remain range-bound.
Nifty 50 Options Chain Analysis
The Nifty 50 options chain indicates that the highest open interest (OI) on the call side is at the 25100 strike, followed by 25300 strikes. On the put side, the highest OI is at the 25000 strike, followed by 24800 strikes. This suggests that the market participants are expecting Nifty 50 to remain range between 24800-25200 levels.
Retail Panic Meets Institutional Calm: A Deep Dive into Options Data
The options market data reveals a stark and telling divergence in sentiment, painting a classic picture of retail panic being met by institutional opportunism. While retail traders are aggressively buying protection and abandoning bullish bets, Foreign Institutional Investors (FIIs) are quietly positioning for a potential market bottom or, at the very least, a cessation of the decline. This tug-of-war suggests the market is at a critical inflection point where peak fear could be setting the stage for a reversal.
Retail’s Bearish Capitulation
The behavior of retail traders signals a significant and fearful shift in sentiment. Their actions are overwhelmingly defensive and bearish:
-
Abandoning Bullish Hopes: Retail traders covered a staggering 254,000 long Call option contracts. This is a massive unwinding of positions that were betting on a market rally. It signifies either profit-taking on minor bounces or, more likely, cutting losses in capitulation, indicating a loss of faith in any further upside.
-
Rushing for Protection: The most dramatic signal is the addition of 390,000 new long Put contracts. Buying puts is a direct bet on a market decline. A surge of this magnitude is a classic sign of panic, as traders rush to buy “insurance” against a crash, often at inflated prices. This fear-driven buying is a hallmark of a potential market bottom.
While they also shorted 321,000 Put contracts (a bullish/neutral stance), this is completely overshadowed by the sheer volume of long Puts bought and long Calls sold. The net sentiment from the retail segment is one of extreme fear and bearishness.
FIIs: The Calm Contrarians
In stark contrast, FIIs, or the “smart money,” are making subtle but powerful contrarian moves. Their activity suggests they are betting against further panic and are positioning to profit from the elevated fear.
-
Selling Insurance to the Panicked: The most crucial action is the shorting of 41,000 new Put contracts. By selling Puts, FIIs are collecting the high premiums being paid by fearful retail traders. This is a conditionally bullish strategy; they are essentially betting that the market will not crash further and will likely stabilize or bounce from current levels.
-
Removing the Upside Cap: FIIs also covered 42,000 short Call contracts. This is a bullish move. By closing these positions, they are removing a barrier that would have capped their potential gains if the market were to rally unexpectedly. It signals they are preparing for the possibility of a sharp relief rally or short squeeze.
Notably, FIIs added very few new directional bets (only 9K long Calls and 2K long Puts), indicating their strategy is not one of aggressive buying, but rather of absorbing the retail panic and positioning for a turn.
Conclusion: The Market Outlook
The data paints a clear picture: retail fear has likely reached a climax. This extreme bearishness from retail, coupled with the calm, premium-collecting strategy of FIIs, is a strong contrarian indicator. The market is now ripe for a potential relief rally or short squeeze. As fearful retail traders have loaded up on Puts, any upward move could force them to cover their positions, adding fuel to a potential rally. The key takeaway is that the smart money is betting against a crash, and historically, it is unwise to bet against them when retail panic is this palpable.
In the cash segment, Foreign Institutional Investors (FII) sold 2133 cr , while Domestic Institutional Investors (DII) bought 2617 cr.
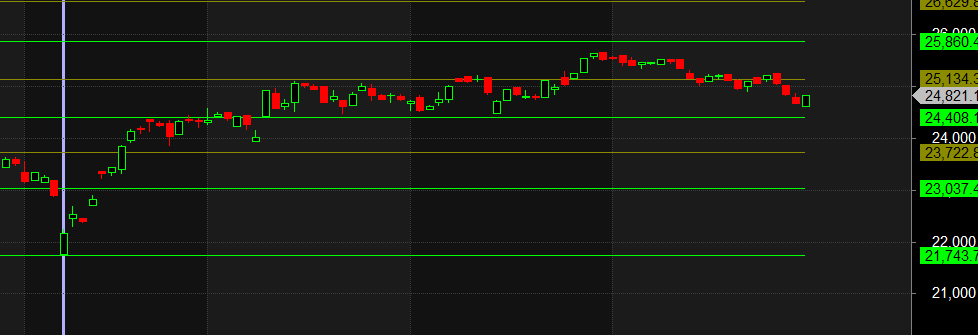
Traders who follow the musical octave trading path may find valuable insights in predicting Nifty’s movements. According to this path, Nifty may follow a path of 23037-23722-24408-25134-25860 This means that traders can take a position and potentially ride the move as Nifty moves through these levels.Of course, it’s important to keep in mind that trading is inherently risky and market movements can be unpredictable.
Every trader has two accounts: the one with their broker and the one in their mind. We spend countless hours managing the first, but it is the second that truly dictates our success or failure. The entire field of the psychology of trading is built on this truth.
For Positional Traders, The Nifty Futures’ Trend Change Level is At 25311. Going Long Or Short Above Or Below This Level Can Help Them Stay On The Same Side As Institutions, With A Higher Risk-reward Ratio. Intraday Traders Can Keep An Eye On 24748, Which Acts As An Intraday Trend Change Level.
Nifty Intraday Trading Levels
Buy Above 24912 Tgt 24950, 24996 and 25055 ( Nifty Spot Levels)
Sell Below 24850 Tgt 24808, 24743 and 24710 (Nifty Spot Levels)
Wishing you good health and trading success as always.As always, prioritize your health and trade with caution.
As always, it’s essential to closely monitor market movements and make informed decisions based on a well-thought-out trading plan and risk management strategy. Market conditions can change rapidly, and it’s crucial to be adaptable and cautious in your approach.
► Join Youtube channel : Click here
► Check out Gann Course Details: W.D. Gann Trading Strategies
► Check out Financial Astrology Course Details: Trading Using Financial Astrology
► Check out Gann Astro Indicators Details: Gann Astro Indicators