


CODE RED: FIIs Unleash Historic Shorting Blitz, Pushing Nifty to a Dangerous Extreme
Some days, the market whispers. Some days, it talks. And on rare occasions, it screams. Today, the data from the Nifty Index Futures market was a primal scream, a signal so loud and unambiguous that it drowns out all other noise.
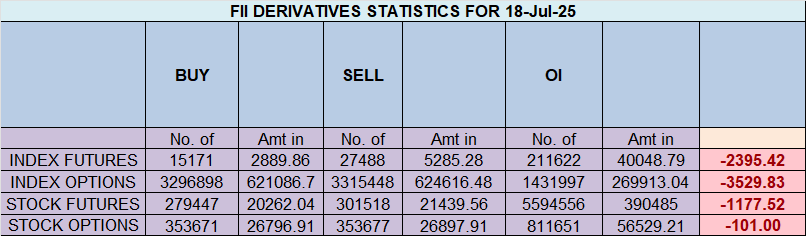
Foreign Institutional Investors (FIIs), the “smart money” that commands the market’s deepest currents, have just executed one of the most aggressive and lopsided bearish attacks in recent history. They net shorted 3,206 contracts worth a staggering ₹602 crore.
But even that massive number fails to capture the sheer ferocity of their conviction. The underlying data reveals a strategic move of such historic bearishness that it pushes the market’s structural integrity to the breaking point. This is a code red alert for every bull, and a moment that will likely define the market’s direction for weeks to come.
The FII Blitzkrieg: A Staggering 10,011 New Shorts
To understand the gravity of today’s events, we must ignore the net figures and look at the gross activity. What the FIIs did today was a masterclass in high-conviction aggression.
-
They added a monumental 10,011 new short contracts. Let that number sink in. This is not a hedge. This is not a cautious trim. This is a full-scale, shock-and-awe shorting campaign, a tidal wave of new bets that the market is heading for a significant fall.
-
They covered 2,306 long contracts. This adds another layer of bearishness. Not only did they hammer the short side with unprecedented force, but they also continued to liquidate their existing bullish positions. It’s a “double bearish” action: exiting the long side while simultaneously building a massive new short position.
This has driven their overall positioning to a level of pessimism that is almost beyond belief.
With a Long:Short ratio of just 15:85, the FII camp is now almost monolithically bearish. This translates into a positional ratio that has cratered to 0.17. This is not a typo. This is an extreme, historically significant level. It means that for every one contract an FII holds betting on a market rise, they now hold nearly six contracts betting on a fall. To see such a one-sided book from the most influential players in the market is an exceptionally rare and powerful warning signal.
The Retail Wall of Optimism: An Unwavering Counterforce
In the face of this institutional onslaught, the Client segment (representing the retail public and HNIs) did not just hold the line; they charged forward with unwavering, almost defiant, optimism.
-
They added a massive 7,145 new long contracts. Retail traders single-handedly absorbed the bulk of the FIIs’ selling pressure and then some, continuing to “buy the dip” with incredible force.
-
They added a negligible 147 new short contracts. This is a stunning detail. It shows that the retail public is almost purely bullish. There is virtually no hedging or bearish sentiment in their actions. They are all-in on the long side.
Their overall positioning reflects this pure bullish conviction. Their Long:Short ratio stands firm at 65:35, with a positional ratio of 1.83. This creates one of the most extreme divergences between FII and retail sentiment ever recorded. It’s a perfect storm of conflicting beliefs.
The data from July 18th is not a warning; it is a final, blaring alarm. The FIIs have made their intentions brutally clear, pushing their bearish positioning to a historic extreme. To fight this institutional tide is to stand in front of a freight train.
The implications for every trader are profound and immediate:
-
This is a “Code Red” Signal: A positional ratio of 0.17 from FIIs is an extraordinary event. It signals that the market’s most powerful players believe the odds of a significant downside correction are overwhelmingly high.
-
The Standoff is Unsustainable: The massive divergence between the 15:85 FII positioning and the 65:35 Client positioning cannot last. One side is about to be proven catastrophically wrong.
-
Volatility is Now a Certainty: The colossal build-up in open interest has created the perfect conditions for a violent, high-momentum move. A break of a key support level could trigger a cascade of long liquidation, while a move above resistance could spark a legendary short squeeze.
We are at a precipice. The institutional giants have placed their biggest bet yet, and the retail public has defiantly taken the other side. The fuse has been lit. The market is holding its breath, and the move that comes next will be one for the history books. Extreme caution and disciplined risk management are no longer optional; they are the only tools for survival.
The Silent Account Killer: How Stress Sabotages Your Trading and the Strategies to Fight Back
Last Analysis can be read here
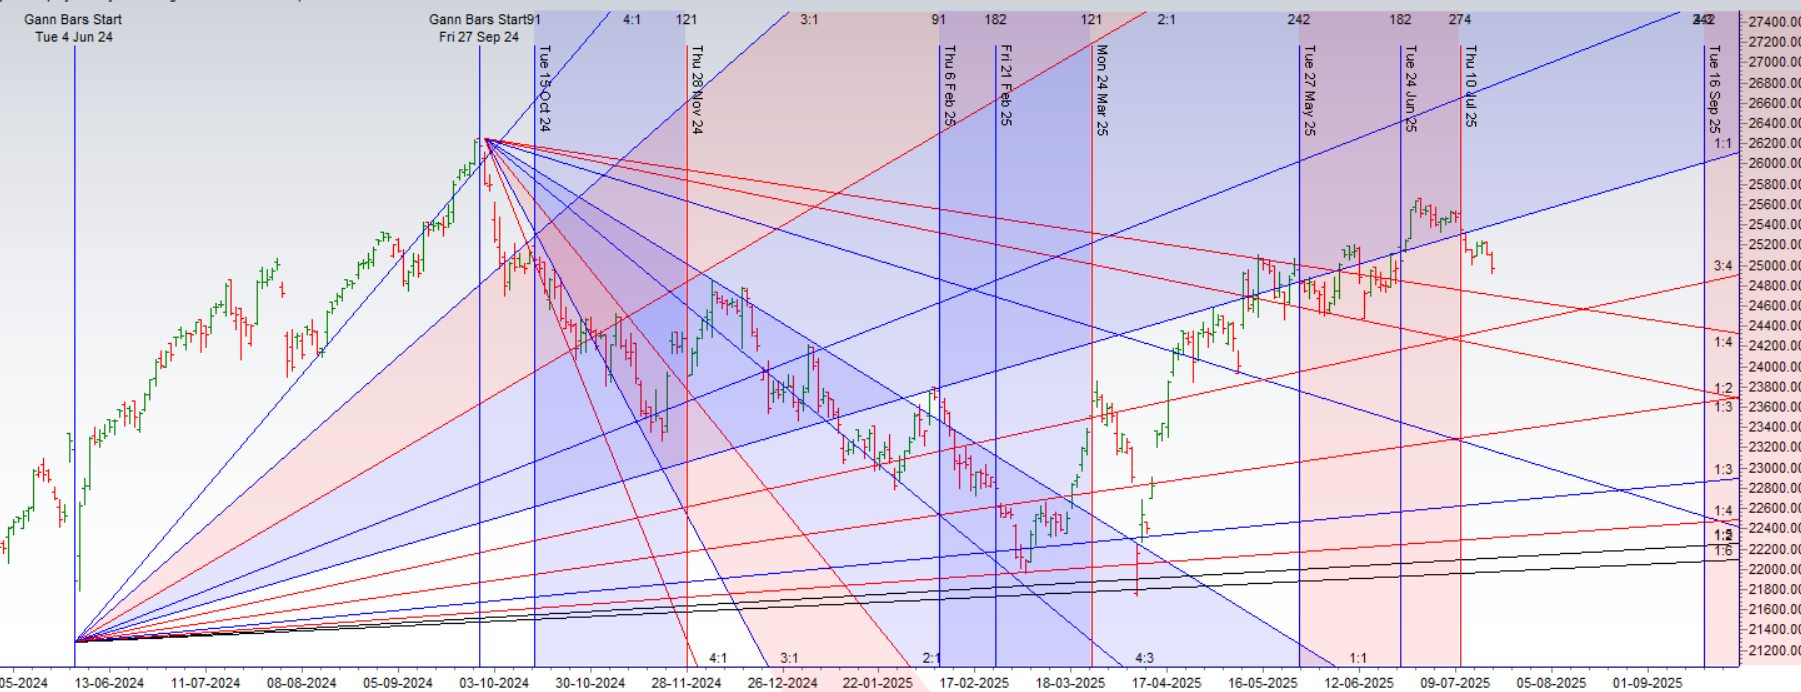
The wall has fallen. After weeks of anticipation and range-bound frustration, the Nifty has finally shattered the colossal psychological barrier of 25,000. This wasn’t a gentle nudge; it was a decisive breach, driven by the sheer fundamental force of a corporate juggernaut and amplified by a rare technical pattern that screams a major move is just getting started.
As the dust settled on the week, the market left us with a tantalizing and high-stakes setup. A powerful astrological event, the Mercury Retrograde , appears to have acted as the catalyst, shaking the market from its slumber. This has been confirmed by the weekly chart, which has now formed an NR21 pattern—a powerful sign of volatility compression that almost always precedes a violent expansion.
But while the bulls are celebrating this victory, the market is holding its breath. The real test comes now, as two banking titans, representing a massive slice of the index, are set to deliver their verdict. This is the story of a breakout, a paradox, and an impending showdown.
The Fuel for the Fire: Reliance’s Blockbuster Performance
You can’t break a wall like 25,000 without overwhelming force, and that force arrived on Friday in the form of Reliance Industries (RIL). The energy-to-retail conglomerate delivered a set of June quarter earnings that can only be described as monumental.
RIL reported its highest-ever consolidated quarterly operating profit and net profit, a stunning achievement that sent a wave of bullish conviction through the market. The details were just as impressive:
-
The telecom arm, Jio, officially surpassed 200 million 5G subscribers, cementing its dominance.
-
The retail business delivered double-digit EBITDA growth with industry-leading margins.
When a company that is one of the heaviest weights in the index posts a record-breaking performance, it does more than just lift its own stock price; it provides a powerful, fundamental floor for the entire market. RIL’s results were the rocket fuel the bulls needed to smash through the 25,000 ceiling.
The Technical Powder Keg: The NR21 Weekly Pattern
Confirming that this is no ordinary breakout is the technical pattern that has just formed on the weekly chart: an NR21.
This stands for the “Narrowest Range of the last 21 weeks.” It is one of the most reliable and potent indicators of an impending volatility explosion. Think of it as a market coiling a spring tighter and tighter over many weeks. The longer the compression, the more violent the eventual release of energy.
The breach of 25,000, combined with the formation of an NR21, is a technical analyst’s dream. It signals that the market has not only broken out but has done so after a period of immense energy consolidation, suggesting the ensuing trend could be powerful and sustained.
The Paradox of Calm: A Dangerously Low VIX
However, amid this bullish euphoria lies a strange and potentially dangerous paradox. The India VIX, the market’s “fear gauge,” has fallen to a 15-month low.
On the surface, this reflects the recent lack of sharp, choppy swings. But historically, extremely low VIX levels are a sign of widespread complacency. It’s the market’s equivalent of a quiet, sunny day just before a hurricane makes landfall. When fear is completely absent and everyone expects the market to keep rising, the potential for a sudden, sharp shock to the system increases dramatically. This low VIX is the single biggest warning sign in an otherwise bullish landscape. It’s the elephant in the room, suggesting that while the path of least resistance appears to be up, the potential for a violent reversal should not be underestimated.
The Weekend Verdict: The 22% Showdown
This brings us to the immediate and most critical catalyst. The market is now waiting for the results of the two undisputed titans of the banking sector, which are set to be declared today:
-
HDFC Bank (Weight: ~13.19%)
-
ICICI Bank (Weight: ~8.79%)
Combined, these two banking giants account for a staggering 22% of the Nifty 50’s total weight.
Their performance will be the ultimate test of the current rally.
-
If the banks deliver strong results, it will validate the breakout, confirm the bullish thesis from RIL, and likely ignite the next leg of the rally, fueled by the energy stored in the NR21 pattern.
-
If their results disappoint, it could throw cold water on the entire market, potentially turning this powerful breakout into a painful bull trap and validating the contrarian warning from the low VIX.
The dangerously low VIX signals a level of complacency that could be punished, and the entire weight of the market’s next move now rests on the shoulders of HDFC Bank and ICICI Bank. Their results will be the final piece of the puzzle, the catalyst that will either confirm this new bull run or trigger a swift and brutal reversal.
The fuse has been lit. The market has made its breakout. Now, it waits for the verdict from the banking giants to determine whether this is the start of a new ascent or the beginning of a painful fall.
Nifty Trade Plan for Positional Trade ,Bulls will get active above 25079 for a move towards 25158/25238. Bears will get active below 24920 for a move towards 24841/24761
Traders may watch out for potential intraday reversals at 09:15,11:20,12:43,02:19 How to Find and Trade Intraday Reversal Times
Nifty July Futures Open Interest Volume stood at 13.7 lakh cr , witnessing liquidation of 0.86 Lakh contracts. Additionally, the increase in Cost of Carry implies that there was closure of LONG positions today.
Nifty Advance Decline Ratio at 15:35 and Nifty Rollover Cost is @24321 closed above it.
Nifty Gann Monthly Buy Level : 25709
Nifty Gann Monthly Sell Level : 25393
Nifty has closed below its 50 SMA @ 25035 Trend is Sell on Rise till below 25100
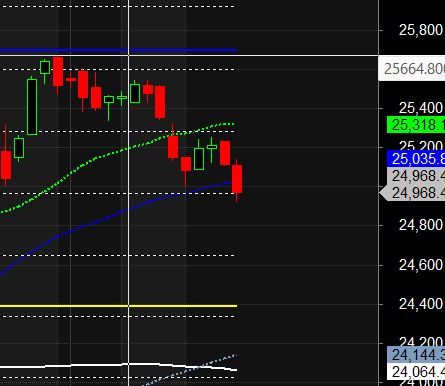
Nifty options chain shows that the maximum pain point is at 25100 and the put-call ratio (PCR) is at 0.59 .Typically, when the PCR open interest ranges between 0.90 and 1.05, the market tends to remain range-bound.
Nifty 50 Options Chain Analysis
The Nifty 50 options chain indicates that the highest open interest (OI) on the call side is at the 25100 strike, followed by 25300 strikes. On the put side, the highest OI is at the 25000 strike, followed by 24800 strikes. This suggests that the market participants are expecting Nifty 50 to remain range between 24800-25200 levels.
Retail’s 3.2 Million Contract Bet on Calm vs. FIIs’ Calculated Bet on Chaos
The Retail Tsunami: A Record-Breaking Bet on Market Stability
The activity in the retail segment is nothing short of breathtaking, driven by one of the largest single-sided bets we have ever witnessed.
The Main Event: A Staggering 3.277 Million Short Puts
Let’s focus on the headline number. While retail traders added a modest 184,000 long put contracts (a bearish bet), they simultaneously SHORTED a mind-boggling 3,277,000 (3.277 million) put contracts.
To understand the gravity of this, we need to know what shorting a put means. In simple terms, it is selling insurance against a market crash. The seller collects a premium (the option’s price) and makes a binding promise to buy the underlying asset at a certain price if it falls. It is a powerfully bullish-to-neutral strategy. It is a bet that the market will not go down significantly.
By selling nearly 3.3 million of these contracts, the retail segment is acting like a massive insurance company, confidently writing policies against a market disaster. Their core belief, backed by billions of rupees, is that the downside is protected and that the premiums they are collecting are “easy money.” This is a sign of extreme confidence, verging on complacency.
The Supporting Act: A Range-Bound View on Calls
In the call options arena, retail traders added 612,000 long contracts but shorted slightly more at 643,000 contracts. This net shorting of call options is a bet that the market will not experience a runaway rally.
When we combine the two, the retail strategy becomes clear: they are betting on a stable or gently rising market. They see limited upside (hence the short calls) but, crucially, they see almost no significant downside risk (hence the colossal number of short puts). They are collecting pennies in front of what could be a steamroller.
The FII Playbook: A Masterclass in Professional De-Risking
Now, let’s contrast this retail hurricane with the quiet, surgical precision of the FIIs. Their activity is less about volume and more about strategy. Every move they made points to a single, coherent conclusion: they are preparing for volatility and hedging against a potential decline.
FIIs’ Call Option Activity: Creating a Ceiling
-
FIIs added 60,000 long call contracts.
-
They shorted 98,000 call contracts.
The net effect is that FIIs were net shorters of 38,000 call contracts. Just like retail, they are betting that the market’s upside is limited. They are creating a “ceiling” and do not expect a powerful rally from current levels. This is their first bearish signal.
FIIs’ Put Option Activity: Actively Buying Insurance
-
FIIs added 70,000 long put contracts.
-
They shorted only 50,000 put contracts.
The net effect here is the most important signal of the day: FIIs were net buyers of 20,000 put contracts. Unlike retail, who are selling insurance, the FIIs are buying it. Buying puts is a direct, capital-intensive hedge or a speculative bet on a market fall. It costs money to do this, and institutions only spend that money when they perceive a real and present danger.
The Cohesive FII Strategy:
When you put the FIIs’ moves together, their strategy is crystal clear and internally consistent:
-
They believe the upside is capped (net short calls).
-
They believe the downside risk is increasing (net long puts).
This is the classic playbook of a professional fund manager who is de-risking a portfolio. They are not panicking, but they are methodically preparing for a storm. Their actions are defensive, cautious, and overwhelmingly bearish in their outlook.
The Great Divide: The Dangerous Implications
We are now witnessing one of the most extreme divergences between “smart money” and retail sentiment in history.
-
Retail is massively short volatility. They win if the market stays calm.
-
FIIs are net long volatility. They are positioned to profit from a chaotic move, especially to the downside.
This creates an incredibly unstable and dangerous market structure. Here’s why:
If the market remains stable or drifts higher, the retail segment will be handsomely rewarded, collecting billions in premium from their short put positions.
However, if the market experiences a sharp and sudden sell-off, the consequences for retail would be catastrophic. A rapid decline would cause the value of the puts they sold to explode. They would be forced to cover their massive short positions by selling futures, creating a “gamma squeeze” effect that would pour fuel on the fire and accelerate the crash.
The FIIs, with their long put positions, would be perfectly positioned to profit from such a scenario.
While the market’s direction is never guaranteed, this data is a five-alarm fire drill. The professionals are preparing for chaos. For everyone else, this is a time for extreme caution.
In the cash segment, Foreign Institutional Investors (FII) bought 374 cr , while Domestic Institutional Investors (DII) bought 2103 cr.
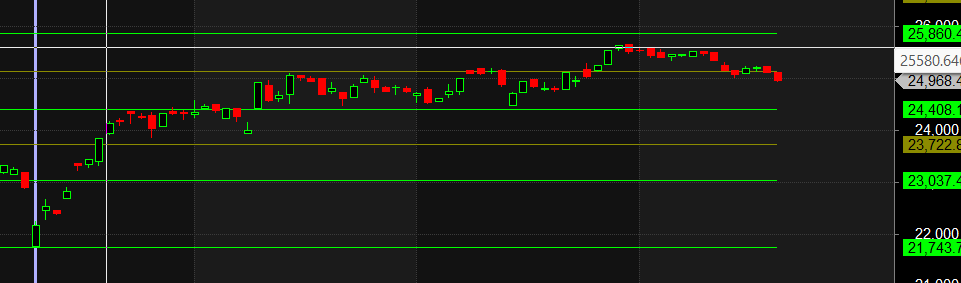
Traders who follow the musical octave trading path may find valuable insights in predicting Nifty’s movements. According to this path, Nifty may follow a path of 23037-23722-24408-25134-25860 This means that traders can take a position and potentially ride the move as Nifty moves through these levels.Of course, it’s important to keep in mind that trading is inherently risky and market movements can be unpredictable.
Don’t trade on emotion. Trading is a numbers game, and it’s important to make decisions based on logic and analysis, not emotion.
For Positional Traders, The Nifty Futures’ Trend Change Level is At 25438 . Going Long Or Short Above Or Below This Level Can Help Them Stay On The Same Side As Institutions, With A Higher Risk-reward Ratio. Intraday Traders Can Keep An Eye On 25043 , Which Acts As An Intraday Trend Change Level.
Nifty Intraday Trading Levels
Buy Above 25008 Tgt 25033, 25066 and 25108 ( Nifty Spot Levels)
Sell Below 24950 Tgt 24915, 24860 and 24816 (Nifty Spot Levels)
Wishing you good health and trading success as always.As always, prioritize your health and trade with caution.
As always, it’s essential to closely monitor market movements and make informed decisions based on a well-thought-out trading plan and risk management strategy. Market conditions can change rapidly, and it’s crucial to be adaptable and cautious in your approach.
► Join Youtube channel : Click here
► Check out Gann Course Details: W.D. Gann Trading Strategies
► Check out Financial Astrology Course Details: Trading Using Financial Astrology
► Check out Gann Astro Indicators Details: Gann Astro Indicators