


Smart Money Turns Bearish, Retail Buys the Dip: A Divergence Warning for Nifty
In the daily battle of the stock market, every trader asks the same question: “What is the smart money doing?” While we can’t get a direct line to the trading desks of major institutions, the daily FII (Foreign Institutional Investors) activity report is the next best thing. It’s a crucial piece of data that gives us a peek into the playbook of the market’s most powerful players.
The data from the July 8th session has painted a fascinating and potentially cautionary picture. It reveals a stark and growing divergence between the actions of the FIIs and the sentiment of retail “Client” traders. It’s a classic tale of two tapes, and understanding this conflict is key to navigating the days ahead.
Let’s break down the numbers and decode what they’re telling us.
The FII Playbook: Bears Take Control
On July 8th, Foreign Institutional Investors made their stance unequivocally clear: they were bearish on the Nifty Index Futures.
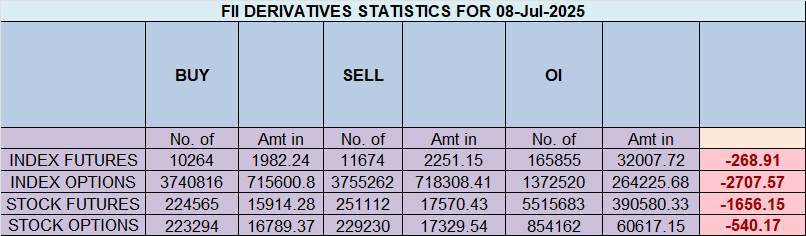
The headline number tells the story: FIIs were net shorters of 1,657 contracts, worth a significant 321 crore.
But to truly understand their conviction, we need to look under the hood at how they built this position.
Breaking Down FII Activity
-
FIIs added 2,783 new long contracts.
-
FIIs added 4,193 new short contracts.
This is the most critical detail. They didn’t just sell their existing long positions; they actively and aggressively built new short positions. The number of new shorts they added was nearly 50% higher than the new longs. This isn’t hedging or profit-taking; this is directional, bearish conviction.
Furthermore, the market saw a net open interest increase of 6,661 contracts. Open Interest tells us how many contracts are open in the market. An increase means new money and new positions are being created. In this context, it confirms that the FIIs’ bearish activity wasn’t just them shuffling old positions around; they were bringing fresh capital to the table to bet on a downside move.
The Retail Response: Unwavering Optimism
While the institutional giants were building their fortress of short positions, the retail “Client” segment was doing the exact opposite. Their behavior was overwhelmingly bullish.
Client Behaviour
-
Clients added a massive 8,620 new long contracts.
-
Clients added only 2,221 new short contracts.
The numbers are staggering in their divergence. Retail traders added almost four times as many long contracts as shorts. They interpreted the day’s price action as a buying opportunity, confidently adding positions with the expectation that the market would rebound. This is classic “buy the dip” behavior, driven by a strong belief that the uptrend will continue.
The Big Picture: A Market Divided
This single day of activity has solidified a dramatic split in the overall market positioning. Let’s look at the cumulative picture:
Current Positioning in Index Futures
-
FII Long/Short Ratio: 28:72 (Ratio of 0.40)
This is a powerfully bearish stance. It means that for every 100 contracts FIIs hold, only 28 are long, while a whopping 72 are short. A ratio this far below 1.0 indicates that the smart money is heavily positioned for a market correction. -
Clients Long/Short Ratio: 57:43 (Ratio of 1.37)
This is a clearly bullish stance. Retail traders are holding more long positions than short positions, confident in an upward move.
It’s like two heavyweight boxers taking opposite corners of the ring. On one side, the research-backed, deep-pocketed FIIs are betting on a fall. On the other, the optimistic and agile retail crowd is betting on a rise.
The Million-Dollar Question: What Does This Mean for Nifty?
Historically, this kind of sharp divergence is a major cautionary signal.
While no single data point can predict the future with 100% certainty, the classic interpretation of this scenario is that the risk is skewed to the downside. The logic is simple: FIIs, with their vast resources and research capabilities, are often ahead of the curve. When they position themselves so heavily against the retail consensus, it’s wise to pay attention.
This doesn’t mean the market will crash tomorrow. But it does suggest:
-
Rallies May Be Sold Into: The heavy FII short position creates a wall of supply. Any attempt by the market to rally could be met with aggressive selling from institutions looking to defend their positions.
-
Support Levels Are More Vulnerable: The conviction of the bears means they will likely press their advantage on any sign of weakness, putting key support levels under significant test.
-
The “Pain Trade” is Down: The market often moves in the direction that causes the most pain to the largest number of participants. In this case, with retail heavily long, a downward move would trap the most traders.
Conclusion for Traders:
The data from July 8th is a clear warning sign. The smart money is bearish, and they are putting their money where their mouth is. The retail crowd is bullishly buying the dip. This is a high-tension setup.
For bulls, this is a time for extreme caution. For bears, this data provides strong confirmation of their thesis. All traders should be focusing on tight risk management and watching key support levels closely. The divergence is clear, and history suggests that it’s rarely wise to bet against the FIIs when their conviction is this strong.
Trading and Probability: How to Make Profitable Predictions
Last Analysis can be read here
A strange quiet has descended upon the Nifty. In the wake of SEBI’s seismic order banning the trading giant Jane Street, the market’s engine has sputtered. Volumes have dried up, and a nervous, sideways consolidation has taken hold. To many, this silence feels like weakness, the prelude to a fall.
But it’s crucial to remember what the market truly is. It is not a delicate machine dependent on any single part. It is a wild elephant—a force of nature. It can be momentarily stunned or stopped in its tracks by a sudden obstacle, but its inherent momentum, the natural force of its action, will eventually reassert itself. The elephant will move its way.
Right now, that elephant is paused, sniffing the air. It’s assessing three critical factors that will determine its next move: a geopolitical storm cloud, a cosmic jolt of energy, and a single, all-important line drawn in the sand.
1. The Post-Ban Hangover: Why the Volume is Gone
The immediate reason for the market’s lethargy is clear: the Jane Street shockwave. The revelation that a major player was allegedly manipulating a key index on such a grand scale has created a crisis of confidence. More practically, it has sucked a significant amount of liquidity and volume out of the system.
This has left a vacuum. The market is now trying to find its true equilibrium without the influence of this major participant. This period of low-volume consolidation is a necessary, albeit unsettling, phase of price discovery. The question on every trader’s mind is: what will fill this vacuum? What will be the next catalyst to make the elephant move again?
2. The Uranian Jolt: IT Stocks on High Alert
The first potential catalyst arrives today in the form of a major astrological event: the Uranus Ingress. In financial astrology, Uranus is the planet of sudden shocks, technological breakthroughs, electricity, and radical change. It is unpredictable, volatile, and brings a jolt of high-voltage energy wherever it goes.
When Uranus enters a new sign, it signals a major shift in the areas it governs. This puts IT stocks squarely on the radar. We should be on high alert for:
-
Sudden, game-changing news in the tech sector.
-
Unexpected breakthroughs or disruptions in areas like AI, software, or telecommunications.
-
Extreme volatility in technology stocks, both to the upside and downside.
This Uranian energy could be the very spark that breaks the market’s current stupor. Traders should be watching the technology sector with extreme focus for signs of unusual activity or trend leadership.
3. The Geopolitical Shadow: Trump, Tariffs, and Trade Wars
While Uranus promises internal disruption, a new shadow looms on the global stage. Reports that former President Trump has imposed a 50% tariff on copper are sending ripples across global markets.
This is more than just a levy on a single commodity. It is a powerful signal that the era of aggressive trade wars may be intensifying once again. Such actions stoke fears of:
-
Global economic slowdowns.
-
Supply chain disruptions.
-
Rising inflation and interest rates.
This is a classic “risk-off” catalyst. It urges caution and could put a significant damper on bullish sentiment, forcing capital towards safe-haven assets and away from equities. This geopolitical headwind provides a strong reason for the market’s current hesitation.
The Line in the Sand: Why 25,331 is Everything for the Bulls
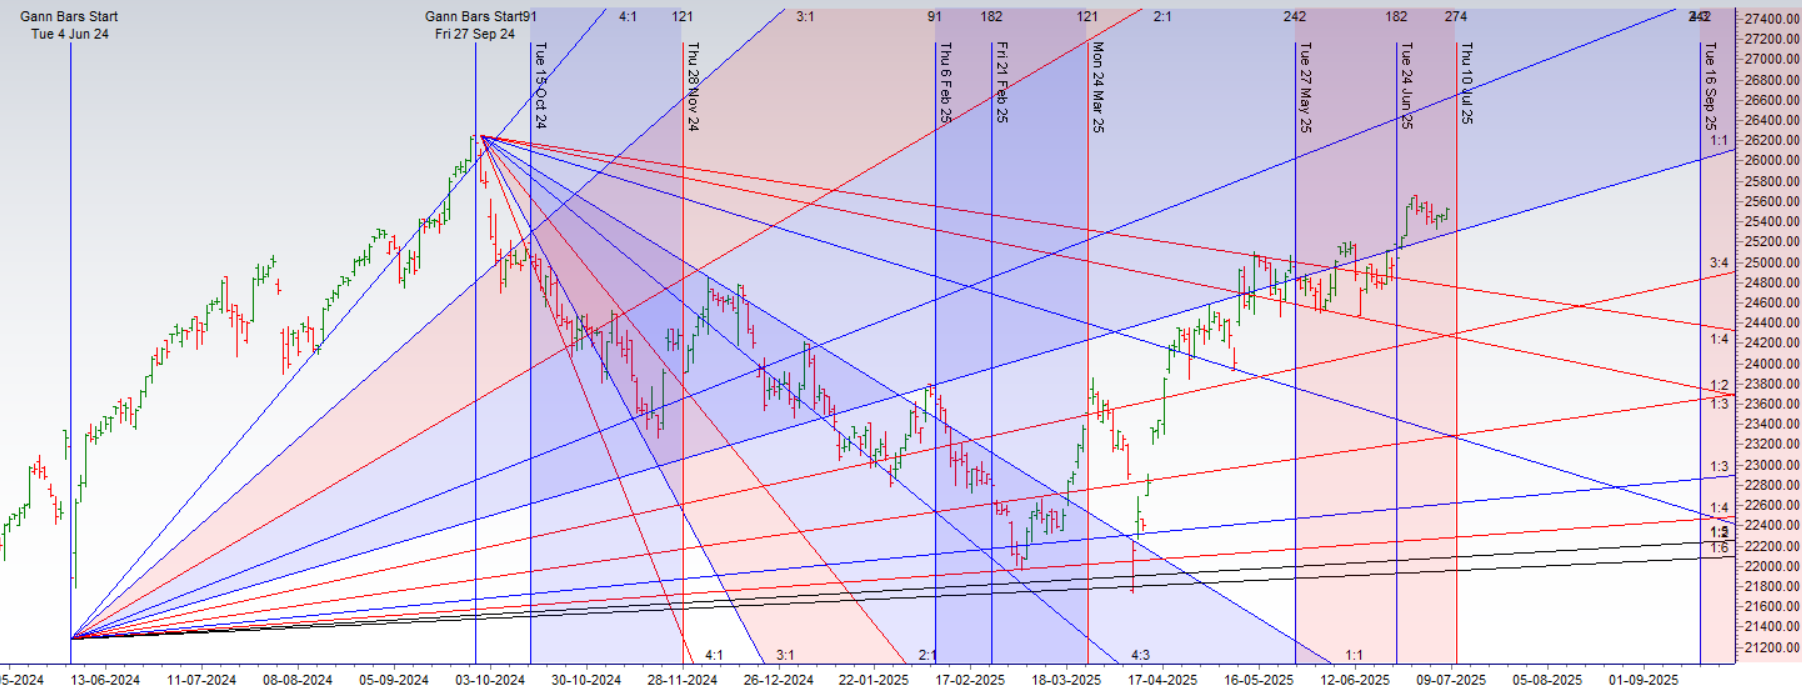
With these powerful and conflicting forces at play, how do we cut through the noise? We turn to the chart, which provides the ultimate, unbiased truth.
As the chart below shows, there is one level that matters more than any other right now: 25,331.
This level is not arbitrary. It is a critical Gann angle support line. In Gann theory, these angles represent the true geometric and vibrational support and resistance of a market. They are the lines of force that contain price action.
The market has corrected down to this exact angle and is holding, for now. This creates a very clear and simple playbook:
-
For the Bulls: As long as Nifty is holding above 25,331 on a closing basis, the bulls technically have the upper hand. Despite the negative news and low volumes, the market’s core bullish structure remains intact as long as this Gann angle provides support.
-
For the Bears: A decisive break and close below 25,331 would be a major victory. It would signal that the combined weight of the Jane Street fallout and geopolitical fears has finally broken the market’s structural support, likely opening the door for a much deeper correction.
Nifty Trade Plan for Positional Trade ,Bulls will get active above 25570 for a move towards 25650/25729. Bears will get active below 25490 for a move towards 25411/24331
Traders may watch out for potential intraday reversals at 09:39,11:46,12:43,01:23,02:24 How to Find and Trade Intraday Reversal Times
Nifty July Futures Open Interest Volume stood at 13.3 lakh cr , witnessing addition of 0.65 Lakh contracts. Additionally, the increase in Cost of Carry implies that there was closure of LONG positions today.
Nifty Advance Decline Ratio at 26:24 and Nifty Rollover Cost is @24321 closed above it.
Nifty Gann Monthly Buy Level : 25709
Nifty Gann Monthly Buy Level : 25393
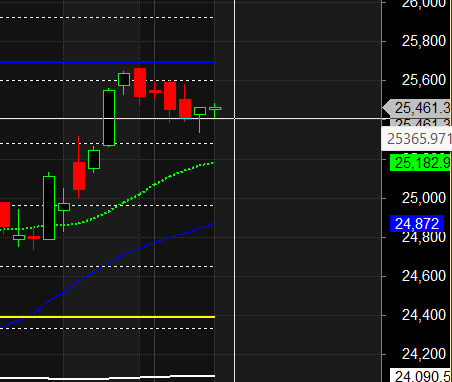
Nifty has closed above its 20 SMA @ 25182 Trend is Sell on Rise till below 25521.
Nifty options chain shows that the maximum pain point is at 25500 and the put-call ratio (PCR) is at 0.93 .Typically, when the PCR open interest ranges between 0.90 and 1.05, the market tends to remain range-bound.
Retail Buys the Dream, FIIs Prepare for a Storm: A Red Flag in the Options Data
The retail segment’s activity is a clear and unambiguous bet on higher market levels. Their actions, particularly on the Put side, scream optimism.
Retail Call Options:
-
Added 59K long contracts
-
Shorted 57K contracts
The Call activity is essentially a wash. Retail traders were buying almost as many calls as they were selling. This indicates mixed sentiment or hedging activity, and on its own, it doesn’t give a strong directional signal. The real story is in their Put activity.
Retail Put Options:
-
Covered 296K contracts
-
Shorted 245K contracts
This is an overwhelmingly bullish signal. Let’s break down what this means:
-
Covering 296,000 Puts: “Covering” a put means closing out a long put position. Traders buy long puts as insurance or to bet on a market fall. By closing nearly 300,000 of these positions, retail traders are essentially saying, “We no longer fear a market decline.” They are willingly giving up their downside protection.
-
Shorting 245,000 Puts: “Shorting” or “writing” a put is a bet that the market will not fall below a certain price. It’s a strategy to collect premium, banking on stability or a market rise. By aggressively shorting this many puts, retail traders are doubling down on their bullish conviction.
The Retail Verdict: By simultaneously ditching their insurance and aggressively selling new insurance to others, the retail segment is displaying extreme confidence and complacency. They are positioned for a continued rally and see very little risk of a downturn.
The FII Playbook: The Subtle Art of Defensive Positioning
In stark contrast, the FIIs’ activity is far more nuanced, cautious, and points towards a completely different market outlook.
FII Call Options:
-
Added 11K long contracts
-
Covered 19K contracts
Here, the FIIs closed out more short call positions than they added new long calls. “Covering” a short call is a defensive move. It’s done when a trader fears the market might rally unexpectedly, causing them losses on their short position. By reducing their short call exposure, FIIs are essentially saying, “We don’t want to be caught naked short in case of a surprise upward spike.” This is a risk-reduction maneuver, not a sign of outright bullishness.
FII Put Options:
-
Covered 3K contracts
-
Covered 10K contracts
(Note: This data point is likely a typo in the original source, as it shows two “covered” actions. The most logical interpretation in standard reporting is that FIIs are closing both their long and short put positions, but in different quantities.)
Assuming the most common interpretation where FIIs are unwinding positions:
-
Closing Long Puts (3K): This is a mildly bullish or neutral action, similar to retail, where they are taking some downside protection off the table.
-
Closing Short Puts (10K): This is the key signal. FIIs are buying back the puts they previously sold. Why? Because they no longer want to be on the hook if the market falls. This is a defensive and inherently bearish action. They are closing out the very positions that retail traders are aggressively entering.
The FII Verdict: The smart money is not making a big directional bet. Instead, they are systematically de-risking. They are closing short positions on both the Call and Put side. They are preparing for a period of increased volatility where being a net seller of options (like the retail crowd) could be dangerous. They are reducing their exposure to a potential market decline.
Conclusion: The Divergence is a Warning Sign
When we put it all together, a clear and cautionary story emerges:
-
Retail is aggressively bullish, selling volatility and betting on stability or a rally.
-
FIIs are defensively cautious, buying back volatility and preparing for a potential storm.
Historically, this is a classic setup for a market reversal. Retail sentiment often acts as a contrary indicator at market extremes. When the crowd becomes this complacent and one-sidedly bullish, it often precedes a “rug pull” event where the market moves in the direction that causes the most pain.
Nifty 50 Options Chain Analysis
The Nifty 50 options chain indicates that the highest open interest (OI) on the call side is at the 25600 strike, followed by 25700 strikes. On the put side, the highest OI is at the 25400 strike, followed by 25300 strikes. This suggests that the market participants are expecting Nifty 50 to remain range between 25300-25600 levels.
In the cash segment, Foreign Institutional Investors (FII) sold 26 cr , while Domestic Institutional Investors (DII) bought 1366 cr.
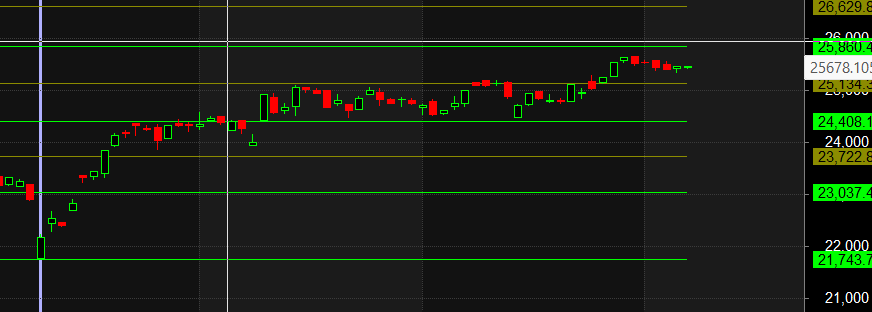
Traders who follow the musical octave trading path may find valuable insights in predicting Nifty’s movements. According to this path, Nifty may follow a path of 23037-23722-24408-25134-25860 This means that traders can take a position and potentially ride the move as Nifty moves through these levels.Of course, it’s important to keep in mind that trading is inherently risky and market movements can be unpredictable.
Don’t trade on emotion. Trading is a numbers game, and it’s important to make decisions based on logic and analysis, not emotion.
For Positional Traders, The Nifty Futures’ Trend Change Level is At 25586. Going Long Or Short Above Or Below This Level Can Help Them Stay On The Same Side As Institutions, With A Higher Risk-reward Ratio. Intraday Traders Can Keep An Eye On 25569 , Which Acts As An Intraday Trend Change Level.
Nifty Intraday Trading Levels
Buy Above 25555 Tgt 25585, 25620 and 25666 ( Nifty Spot Levels)
Sell Below 25500 Tgt 25464, 25424 and 25400 (Nifty Spot Levels)
Wishing you good health and trading success as always.As always, prioritize your health and trade with caution.
As always, it’s essential to closely monitor market movements and make informed decisions based on a well-thought-out trading plan and risk management strategy. Market conditions can change rapidly, and it’s crucial to be adaptable and cautious in your approach.
► Join Youtube channel : Click here
► Check out Gann Course Details: W.D. Gann Trading Strategies
► Check out Financial Astrology Course Details: Trading Using Financial Astrology
► Check out Gann Astro Indicators Details: Gann Astro Indicators