


FIIs Unleash Bullish Force on Expiry Day: Decoding the Smart Money’s Move in Nifty
Hello fellow traders and analysts.
The monthly F&O expiry on June 27th was a fascinating session, and as always, the institutional data tells a story that goes beyond the price action. Foreign Institutional Investors (FIIs) sent a clear and strong bullish signal in the Nifty Index Futures, a move that warrants our close attention as we head into the new July series.
Let’s break down the numbers and understand what the “smart money” is telling us.
The Headline: FIIs Turn Net Buyers on Expiry
The top-line data shows that FIIs were net buyers, purchasing 16,344 contracts worth a significant ₹3,138 crores.
Now, you might notice that the net open interest (OI) decreased by 51,728 contracts. Don’t let this confuse you. A drop in OI on an expiry day is perfectly normal, as existing contracts for the expiring month are closed out. The key takeaway here is the net buying figure, which points to a strong positive bias from the FII desk during the session.
Deep Dive: The Real Story is in the Short Covering
This is where the analysis gets truly insightful. A closer look at the FII activity reveals a powerful dynamic:
-
✅ FIIs added 8,452 new long contracts: This shows fresh bullish conviction. They were willing to initiate new “buy” positions for the upcoming series.
-
✅ FIIs covered a massive 63,451 short contracts: This is the most crucial data point of the day. “Short covering” means they were aggressively closing their existing bearish bets. A number this large isn’t just routine position management; it signals a belief that the potential for further downside is limited, forcing them to exit their short positions in a hurry.
When you combine aggressive short covering with the addition of fresh longs, the message is clear: the sentiment from the FII camp on Thursday was overwhelmingly bullish.
The Classic Divergence: Smart Money vs. Retail
As we often see at crucial market junctures, the behaviour of retail participants (classified as “Clients”) was the mirror opposite of the institutional players.
-
❌ Clients covered 34,947 long contracts: Retail traders were seen exiting their bullish positions, likely booking profits or cutting losses into the expiry.
-
❌ Clients added 1,933 short contracts: A smaller, yet notable, number of retail participants initiated fresh bearish bets, trying to short the market.
This divergence is a classic pattern. While the FIIs were building a bullish case, retail traders were liquidating longs and adding shorts. Historically, it pays to follow the smart money.
Current Positioning: A Word of Caution
While the activity on June 27th was decisively bullish, we must look at the overall positioning to get the complete picture for the new series.
-
FII Long/Short Ratio stands at 0.61 (38% Long vs 62% Short). This means that despite the heavy short covering, FIIs are still carrying more short positions than long positions overall. This could be for hedging purposes or indicate that they haven’t completely abandoned their cautious stance.
-
Clients Long/Short Ratio is at 1.15 (54% Long vs 46% Short). As expected, retail traders are collectively net long on the market.
Analytical Takeaway & What to Watch For
-
Powerful Bullish Intent: The massive short covering by FIIs is a significant positive. It reduces the overhead supply and suggests that strong support levels are likely to be defended.
-
A Shift in Stance: This activity marks a potential shift from the bearish/cautious stance FIIs held previously. They have lightened their short exposure considerably.
-
The Ratio is Key: The critical factor to watch in the coming sessions is the FII Long/Short Ratio. If we see them continue to add new longs and their ratio starts climbing from 0.61 towards 1.0 (and beyond), it would confirm that a genuine and sustainable bullish trend is building.
-
Cautious Optimism: For now, the data supports a cautiously optimistic view. The immediate bearish pressure has been lifted. The market is now looking for follow-through buying from the institutional players to carry the momentum forward into the July series.
Keep a close eye on this data. In trading, it’s not just about what you see on the charts, but also about understanding who is doing the buying and selling.
The Indian Dream: Can You Really Become a Crorepati Trading Stocks in India?
Last Analysis can be read here
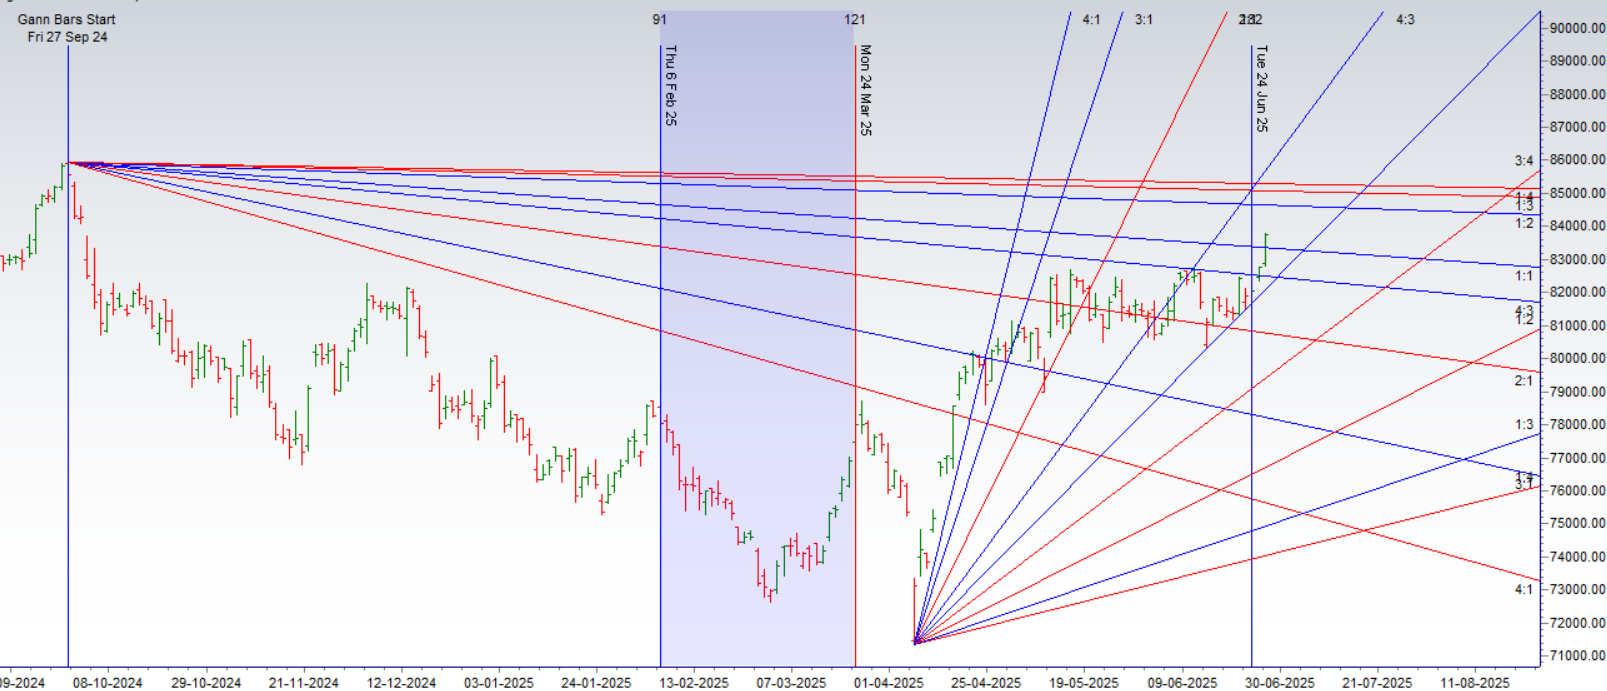
As we’ve been discussing, the powerful influence of the double lunar date was expected to have a significant impact on the market, and it delivered spectacularly on expiry day. We witnessed a massive, high-momentum move in Nifty, capturing over 300+ points exactly as anticipated. This is a perfect real-world example of how using a confluence of Gann theory and Astro-financial cycles can help traders identify and capture these large, profitable swings.
The Next Catalyst: Mercury Enters Leo
Now, we look ahead to the next key celestial event. Tomorrow, Mercury will be transiting into the Leo Zodiac. From a market perspective, such planetary shifts are important events that often coincide with increased volatility, changes in sentiment, and key inflection points in price.
Key Levels & The Crucial Weekly Close
With this Astro event aligning with the weekly closing session, the battle lines are clearly drawn. The bulls will be fighting to establish their dominance and secure a strong close for the week.
The key zone to watch is 25666 – 25700 on Bank Nifty. A decisive weekly close above this resistance range would be a significant victory for the bulls and would set a positive tone for the week ahead.
Actionable Intraday Strategy for Tomorrow
For intraday traders looking to navigate tomorrow’s potential volatility, a simple yet effective opening range breakout strategy can be deployed:
-
The First 16-Minute Rule:
-
Mark the High and the Low of the first 16 minutes of the trading session (9:15 AM to 9:31 AM).
-
This range defines the initial battlefield for the day.
-
A sustained move above the 16-minute high can be used as an entry trigger for long positions.
-
Conversely, a breakdown below the 16-minute low can be a trigger for short positions.
-
This method allows you to trade with the direction of the day’s initial, powerful momentum. As always, use strict stop-losses and manage your risk diligently.
Let’s watch to see if the bulls can harness the energy from Mercury’s transit to conquer the key levels.
Nifty Trade Plan for Positional Trade ,Bulls will get active above 25612 for a move towards 25770/25927. Bears will get active below 25455 for a move towards 25297/25140.
Traders may watch out for potential intraday reversals at 10:01,12:28,02:25 How to Find and Trade Intraday Reversal Times
Nifty July Futures Open Interest Volume stood at 14.8 lakh cr , witnessing adition of 17.5 Lakh contracts. Additionally, the increase in Cost of Carry implies that there was closure of SHORT positions today.
Nifty Advance Decline Ratio at 42:08 and Nifty Rollover Cost is @24321 closed above it.
Nifty Gann Monthly Buy Level : 24822
Nifty Gann Monthly Buy Level : 24669
Nifty has closed above its 20 SMA @ 24933 Trend is Buy on Dips till above 25000.
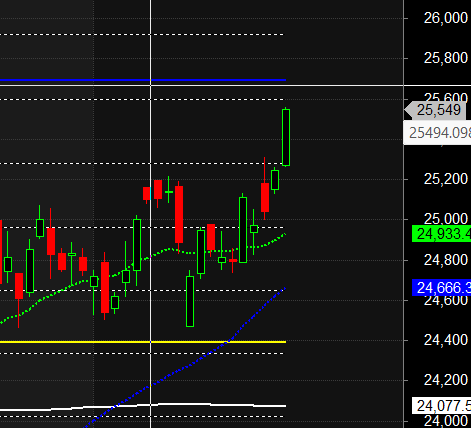
Nifty options chain shows that the maximum pain point is at 25400 and the put-call ratio (PCR) is at 1.36.Typically, when the PCR open interest ranges between 0.90 and 1.05, the market tends to remain range-bound.
Nifty 50 Options Chain Analysis
The Nifty 50 options chain indicates that the highest open interest (OI) on the call side is at the 25600 strike, followed by 25700 strikes. On the put side, the highest OI is at the 25500 strike, followed by 25400 strikes. This suggests that the market participants are expecting Nifty 50 to remain range between 25500-25800 levels.
In the cash segment, Foreign Institutional Investors (FII) bought 12594 cr , while Domestic Institutional Investors (DII) sold 195cr.
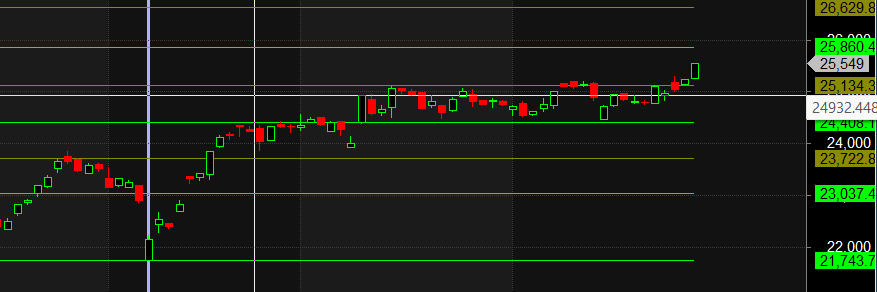
Traders who follow the musical octave trading path may find valuable insights in predicting Nifty’s movements. According to this path, Nifty may follow a path of 23037-23722-24408-25134-25860 This means that traders can take a position and potentially ride the move as Nifty moves through these levels.Of course, it’s important to keep in mind that trading is inherently risky and market movements can be unpredictable.
Be patient. The market is constantly changing, and it’s important to be patient when trading. Don’t expect to make a lot of money overnight. Be patient and let the market work in your favor.
For Positional Traders, The Nifty Futures’ Trend Change Level is At 25527. Going Long Or Short Above Or Below This Level Can Help Them Stay On The Same Side As Institutions, With A Higher Risk-reward Ratio. Intraday Traders Can Keep An Eye On 25527, Which Acts As An Intraday Trend Change Level.
Nifty Intraday Trading Levels
Buy Above 25600 Tgt 25636, 25666 and 25700 ( Nifty Spot Levels)
Sell Below 25555 Tgt 25512, 25470 and 25420 (Nifty Spot Levels)
Wishing you good health and trading success as always.As always, prioritize your health and trade with caution.
As always, it’s essential to closely monitor market movements and make informed decisions based on a well-thought-out trading plan and risk management strategy. Market conditions can change rapidly, and it’s crucial to be adaptable and cautious in your approach.
► Join Youtube channel : Click here
► Check out Gann Course Details: W.D. Gann Trading Strategies
► Check out Financial Astrology Course Details: Trading Using Financial Astrology
► Check out Gann Astro Indicators Details: Gann Astro Indicators