Bank Nifty’s 1000-Point Swing? Astro Dates & IPO Liquidity Drain Converge

By | June 25, 2025 8:21 am

FIIs Cover Shorts in Bank Nifty, Bullish Stance Maintained

As per the end-of-day data, Foreign Institutional Investors (FIIs) maintained their Bullish stance in the Bank Nifty Index Futures market by Buying 3865 contracts worth 564 crore.

This headline number clearly indicates buying interest from the FII desk. However, the real story and the most important detail for any serious trader lies in the Open Interest (OI) data.

The data shows that this move resulted in a net open interest (OI) decrease of 3177 contracts.

Analysis: A Clear Case of Short Covering

Traders, this is a classic and textbook example of Short Covering.

When we see net buying activity from a participant group accompanied by a simultaneous decrease in the overall Open Interest, it signals that the buying is primarily being done to close out existing short positions. The bears who had previously sold the Bank Nifty futures are now buying back their contracts to exit their trades, likely to book profits or cut losses as the market refuses to go down further.

While short covering is a bullish sign as it removes selling pressure and provides a floor to the market, it is important to distinguish it from a “Long Buildup” (which is Buying + OI Increase). A Long Buildup would have indicated the creation of fresh, aggressive bullish bets and would have signaled a much stronger conviction for an up-move.

Conclusion and Way Forward

The key takeaway from today’s data is that FIIs are actively reducing their bearish exposure in the Bank Nifty. The pressure from sellers is easing, which is a positive development for the bulls. This action suggests that the downside in the Bank Nifty might be limited in the immediate term.

For the bullish momentum to accelerate, we need to see this short covering activity evolve into fresh long creation in the upcoming trading sessions. Traders should keep a close eye on the OI data to see if buyers are entering with fresh conviction, which would be the signal for the next leg of the rally.

How to Become a Professional Trader: A Step-by-Step Guide

Last Analysis can be read here 

Traders, the market is presenting a fascinating and high-stakes setup. Yesterday, the Bank Nifty formed a classic Doji candle, signaling perfect indecision at a critical juncture. This pause came as the market absorbed the positive geopolitical news of the Iran-Israel ceasefire talks.

Today, we are once again poised for a potential gap-up opening. But the most important question on every trader’s mind is not if we gap up, but if the gap will sustain.

The answer to this question is complex, lying at the intersection of powerful celestial alignments, crucial Gann levels, and a significant market event that cannot be ignored.

The Astro Catalyst and The Liquidity Hurdle

Pay close attention. Today and tomorrow are the most important astro dates for the current market cycle. Today is a Double Lunar Date, a very potent astrological event. As we have demonstrated with back-tested data, these dates often act as powerful catalysts. Past instances of similar astro dates have triggered massive 700-1000 point moves in the Bank Nifty within just two trading sessions.

However, this powerful bullish astro potential faces a significant headwind. Today, a large HDFC Group company IPO worth a massive ₹12,500 crore will open for subscription. An IPO of this magnitude will inevitably suck a substantial amount of liquidity from the secondary market, as big funds and investors allocate capital to the primary offering. This liquidity drain can act as a brake on any potential runaway rally.

We are therefore witnessing a classic tug-of-war: the bullish pull of the cosmos versus the bearish drag of market liquidity.

The Decisive Gann & Musical Octave Levels

In such a complex environment, we must rely on our proven levels to navigate the impending volatility. The market has given us two sacred lines in the sand. A break of either side will likely resolve the indecision of the Doji and unleash the forecasted 700-1000 point move.

  • The Bullish Trigger (Musical Octave): The crucial resistance on the upside is at 56,734. This is a key Musical Octave level. A sustained move above this level will confirm that the astro forces have overpowered the liquidity drain, paving the way for a sharp rally towards our upper targets.

  • The Bearish Trigger (Gann Trend Change): The key pivot and support is the Gann Monthly Trend Change (TC) level at 56,222. If the market fails to sustain its opening gains and breaks below this level, it will signal that the liquidity drain is taking its toll. A break of 56,222 will open the floodgates for the bears.

Conclusion:

Traders, the stage is set for an explosive move. The battle lines are drawn between 56,734 on the upside and 56,222 on the downside. Given the conflicting forces at play, it is imperative to trade cautiously on the levels mentioned. Do not get caught in the initial whipsaws. Wait for a decisive breakout or breakdown of these levels, as the subsequent move is likely to be fast and furious.


Bank Nifty Trade Plan for Positional Trade ,Bulls will get active above 56509 for a move towards 56745/56980/57216. Bears will get active below 56273 for a move towards 56037/55802/55556

Traders may watch out for potential intraday reversals at 09:33,10:29,12:30,02:20  How to Find and Trade Intraday Reversal Times

Bank Nifty May Futures Open Interest Volume stood at 17.6 lakh, with liquidation of 0.48 lakh contracts. Additionally, the Increase in Cost of Carry implies that there was a closure of LONG positions today.

Bank Nifty Advance Decline Ratio at 11:01 and Bank  Nifty Rollover Cost is @55480 closed below it.

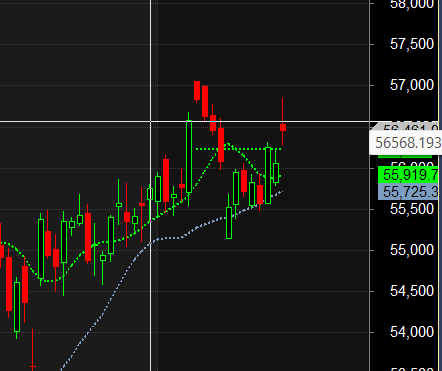
BANK Nifty Gann Monthly Buy Level : 55941

BANK Nifty Gann Monthly Buy Level : 55254

Bank Nifty closed ABOVE its 20 SMA @55919 ,Trend is Buy on Dips till above 55950


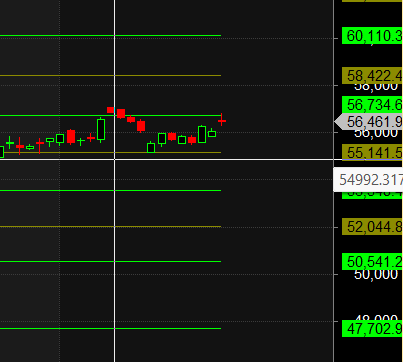
Traders who follow the musical octave trading path may find valuable insights in predicting Bank Nifty’s movements. According to this path, Bank Nifty may follow a path of 53548-55141-56734. This means that traders can take a position and potentially ride the move as Bank Nifty moves through these levels. Of course, it’s important to keep in mind that trading is inherently risky and market movements can be unpredictable.


According to the Bank Nifty options chain, the call side has the highest open interest (OI) at the 56500 strike, followed by the 57000 strike. On the put side, the 56000 strike has the highest OI, followed by the 55500 strike.This indicates that market participants anticipate Bank Nifty to stay within the 55000-56000 range. 

The Bank Nifty options chain shows that the maximum pain point is at 56000 and the put-call ratio (PCR) is at 0.85 Typically, when the PCR open interest ranges between 0.90 and 1.05, the market tends to remain range-bound. PCR is on extreme end suggesting we can see sharp reversal .

Those who succeed big at anything all have the same attitude: You keep going until it happens or you die trying. Quitting is not an option.

For Positional Traders, The Bank Nifty Futures’ Trend Change Level is At 56138 . Going Long Or Short Above Or Below This Level Can Help Them Stay On The Same Side As Institutions, With A Higher Risk-reward Ratio. Intraday Traders Can Keep An Eye On 55784, Which Acts As An Intraday Trend Change Level.

BANK Nifty Intraday Trading Levels

Buy Above 56575 Tgt 56790, 56950 and 57119 (BANK Nifty Spot Levels)

Sell Below 56400 Tgt 56225, 56050 and 55850 (BANK Nifty Spot Levels)

Wishing you good health and trading success as always.As always, prioritize your health and trade with caution.

As always, it’s essential to closely monitor market movements and make informed decisions based on a well-thought-out trading plan and risk management strategy. Market conditions can change rapidly, and it’s crucial to be adaptable and cautious in your approach.

► Join Youtube channel : Click here

Check out Gann Course Details: W.D. Gann Trading Strategies

Check out Financial Astrology Course Details: Trading Using Financial Astrology

Check out Gann Astro Indicators Details: Gann Astro Indicators

Category: Bank Nifty Bank Nifty Astrology

About Bramesh

Bramesh Bhandari has been actively trading the Indian Stock Markets since over 15+ Years. His primary strategies are his interpretations and applications of Gann And Astro Methodologies developed over the past decade.

Leave a Reply