


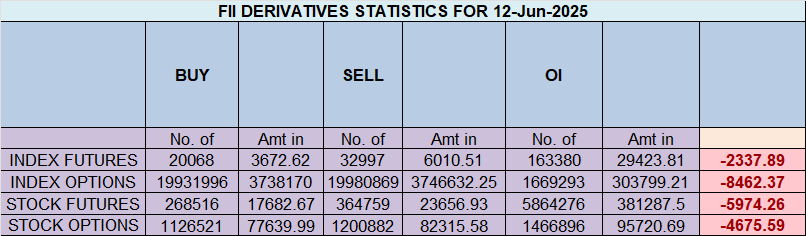
FII & Client Activity – Nifty Index Futures (12 June 2025)
Foreign Institutional Investors (FIIs)
FIIs maintained a Bearish stance, actively building Shorts positions and unwinding Longs
-
Longs Covered: 2522
-
Shorts Added : 10407
-
Total Value: ₹1564 crore
-
Net Open Interest Change: +6145 contracts
Interpretation:
A clear shift in sentiment as FIIs increased their net shorts while covering significant longs.
Client Behavior
-
Longs Added: 6298
-
Shorts Covered : 5633
Current Positioning Snapshot
| Category | Long % | Short % | Long:Short Ratio |
|---|---|---|---|
| FIIs | 22% | 78% | 0.28 |
| Clients | 60% | 40% | 1.47 |
Master Losses: Your Trading War Journal for Unbreakable Discipline
You can read the Previous Day Analysis by clicking on this link.
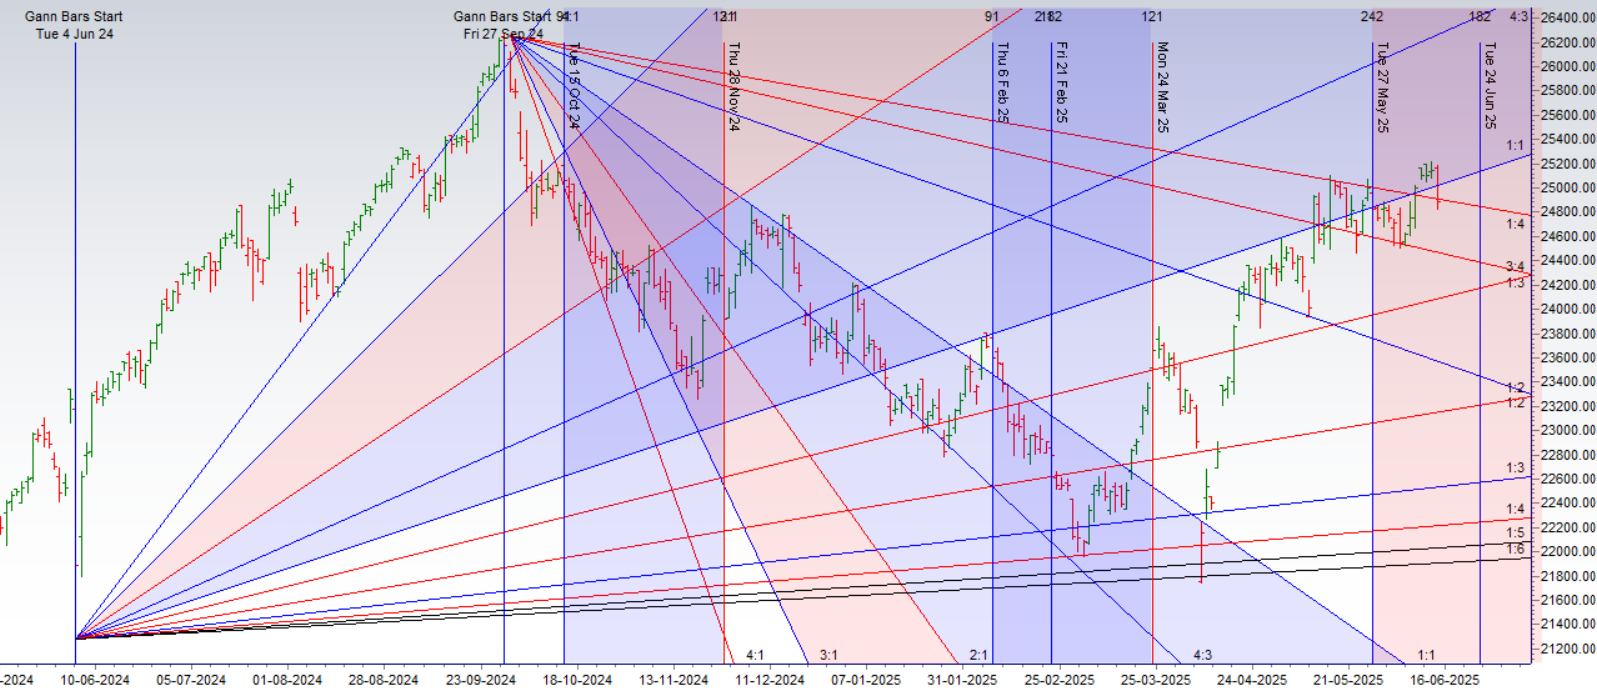
Nifty has now entered a high-alert zone. The RBI Policy Day low of 24671 has become a crucial support level.
If the index breaks and closes below 24671 on a weekly basis, it would open the gates for a deeper retracement, potentially dragging it toward the 24389–24108 zone.
Astro Timing Perfectly Captures the Fall
As discussed in the video analysis, two critical Bayer Rules came into effect this week and provided timely signals for the impending reversal:
Bayer Rule 7:
“There are changes in the market when Venus or Mars passes over its Aphelion/Perihelion (Geocentric) positions.”
This rule has historically aligned with sharp turns in financial instruments, especially in banking and metal sectors.
Bayer Rule 38:
“Some mighty fine tops and bottoms are produced when Mercury in heliocentric motion passes key latitude degrees.”
The combined effect of Venus and Mercury timing signaled exhaustion at recent highs, aligning perfectly with the geopolitical trigger.
Strategic Takeaways for Traders
-
Watch 24671 on Nifty: A close below could lead to a swift correction.
-
Expect high volatility due to geopolitical tensions + upcoming US Fed commentary.
-
Crude spike = Negative for banks, oil-importing sectors, and macros.
-
Protect long positions with puts or tight trailing stops.
️ Final Word: When Price, Time & Events Align — Respect the Signal
What’s unfolding now is a classic example of how Gann price levels + Astro timing + Global events come together to produce decisive moves. As a trader, your job is not to predict the news, but to recognize the signal when it arrives.
Stay nimble. Trade safe.
Nifty Trade Plan for Positional Trade ,Bulls will get active above 25120 for a move towards 25277/25433. Bears will get active below 24964 for a move towards 24807/24651
Traders may watch out for potential intraday reversals at 09:30,10:47,12:36,01:54,02:39 How to Find and Trade Intraday Reversal Times
Nifty May Futures Open Interest Volume stood at 1.14 lakh cr , witnessing liquidation of 0.84 Lakh contracts. Additionally, the increase in Cost of Carry implies that there was covering of SHORT positions today.
Nifty Advance Decline Ratio at 28:22 and Nifty Rollover Cost is @24321 closed above it.
Nifty Gann Monthly Buy Level : 24822 — Closed above it
Nifty Gann Monthly Buy Level : 24669
Nifty has closed above its 20 SMA @ 24856 Trend is Sell on Rise Till below 25000.
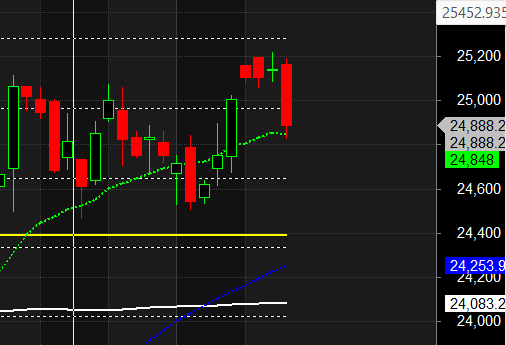
Nifty options chain shows that the maximum pain point is at 24800 and the put-call ratio (PCR) is at 0.86.Typically, when the PCR open interest ranges between 0.90 and 1.05, the market tends to remain range-bound.
Nifty 50 Options Chain Analysis
The Nifty 50 options chain indicates that the highest open interest (OI) on the call side is at the 24800 strike, followed by 24900 strikes. On the put side, the highest OI is at the 24500 strike, followed by 24300 strikes. This suggests that the market participants are expecting Nifty 50 to remain range between 24500-24800 levels.
In the cash segment, Foreign Institutional Investors (FII) sold 3831 cr , while Domestic Institutional Investors (DII) bought 9393 cr.
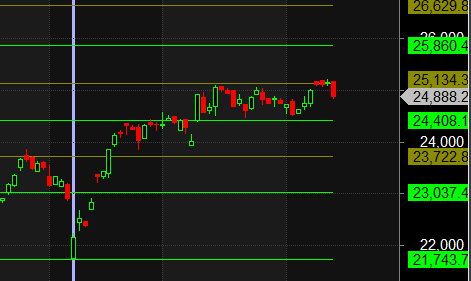
Traders who follow the musical octave trading path may find valuable insights in predicting Nifty’s movements. According to this path, Nifty may follow a path of 23037-23722-24408-25134-25860 This means that traders can take a position and potentially ride the move as Nifty moves through these levels.Of course, it’s important to keep in mind that trading is inherently risky and market movements can be unpredictable.
Those who succeed big at anything all have the same attitude: You keep going until it happens or you die trying. Quitting is not an option.
For Positional Traders, The Nifty Futures’ Trend Change Level is At 24946. Going Long Or Short Above Or Below This Level Can Help Them Stay On The Same Side As Institutions, With A Higher Risk-reward Ratio. Intraday Traders Can Keep An Eye On 25233 , Which Acts As An Intraday Trend Change Level.
Nifty Intraday Trading Levels
Buy Above 24610 Tgt 24640, 24685 and 24729 ( Nifty Spot Levels)
Sell Below 24555 Tgt 24512, 24470 and 24424 (Nifty Spot Levels)
Wishing you good health and trading success as always.As always, prioritize your health and trade with caution.
As always, it’s essential to closely monitor market movements and make informed decisions based on a well-thought-out trading plan and risk management strategy. Market conditions can change rapidly, and it’s crucial to be adaptable and cautious in your approach.
► Join Youtube channel : Click here
► Check out Gann Course Details: W.D. Gann Trading Strategies
► Check out Financial Astrology Course Details: Trading Using Financial Astrology
► Check out Gann Astro Indicators Details: Gann Astro Indicators