


Astrological Events & Market Impact: Prepare for Heightened Volatility
The holiday-shortened week ahead brings critical astrological alignments historically linked to significant market shifts. Traders and investors are advised to brace for potential volatility, trend reversals, and breakout opportunities across equities, commodities, and interest rate-sensitive sectors.
Critical Astrological Cycles & Historical Market Reactions
- Venus Conjunct Mercury
- Impact: Sharp price swings in financial stocks, banking sectors, and interest rate-sensitive assets.
- Action: Monitor central bank communications.
- Sun Conjunct Saturn
- Impact: Consolidation phases followed by strong directional breakouts.
- Historical Data: Post-conjunction periods often coincide with sustained trends in indices
- Bayer Rule 27 Activation
- Key Insight: Major market tops/bottoms occur when Mercury’s geocentric longitude speed hits 59’ or 1°58’.
- Strategy: Confirm trend shifts by aligning price action with this astro timing.
- Bayer Rule 21 (Variation C)
- Key Insight: Retrograde Venus-Mercury conjunctions often trigger strong market moves within 5-8 days.
- Forecast: Anticipate sharp reversals in commodities (gold, oil) and tech stocks.
- Lunar Eclipse
- Impact: High volatility in equities and commodities, with potential trend reversals.
- Watch: Pre-eclipse price extremes as possible pivot points.
Sector-Sensitive Trading Strategies for the Week
- Volatility Preparation: Tighten stop-loss orders and prioritize liquidity in fast-moving markets.
- Breakout Zones: Identify key support/resistance levels in banking, metals (gold, silver), and IT indices for confirmation signals.
High-Risk Sectors
- Banking & Financials: Sensitivity to Venus-Mercury cycles.
- Metals & Commodities: Lunar eclipse impacts on gold, silver, and crude oil.
- Tech Stocks: Watch for Sun-Saturn conjunction-driven momentum shifts.
Astro analysis can help identify trends and reversals in the market, and it can be used in combination with other technical analysis methods to improve the accuracy of trading strategies. Gann analysis involves studying charts and identifying support and resistance levels to pinpoint potential trading opportunities.
Nifty Harmonic Pattern
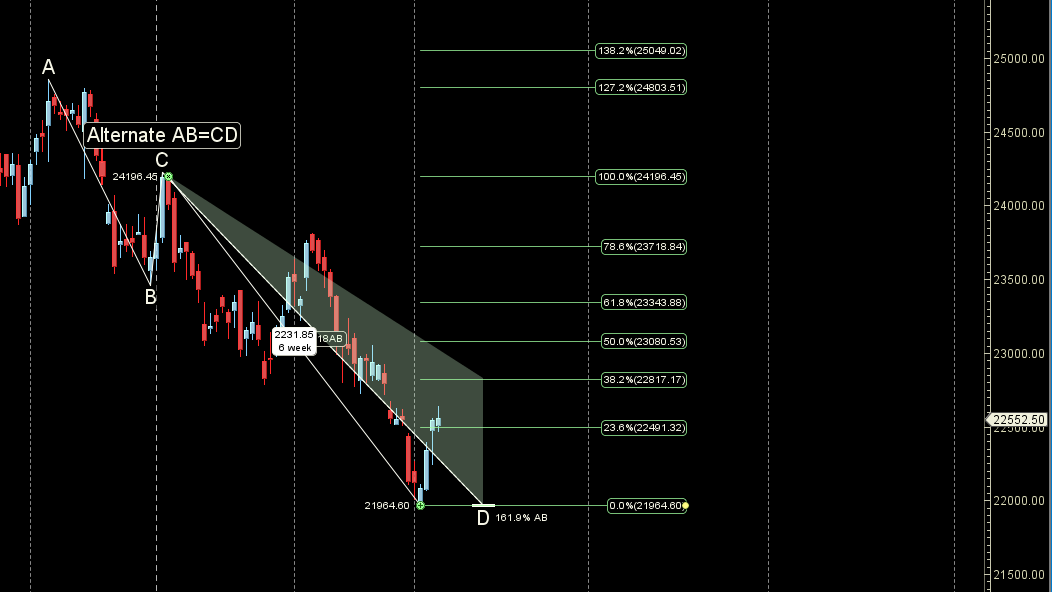
Price is completed its PRZ zone of Alternate ABCD Pattern Holding 22250 can see rally towards 22817-22850.
Nifty Gann Angles
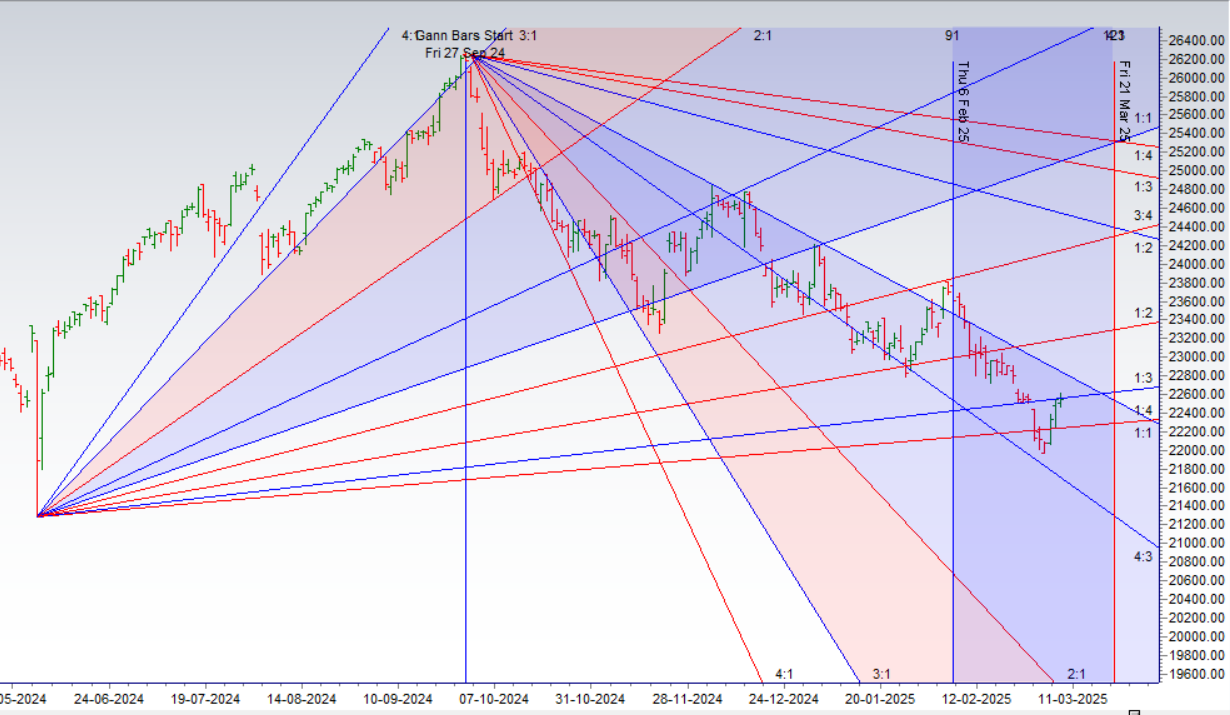
Price is back to its 1×3 gann angle resistance zone.
Nifty Supply and Demand
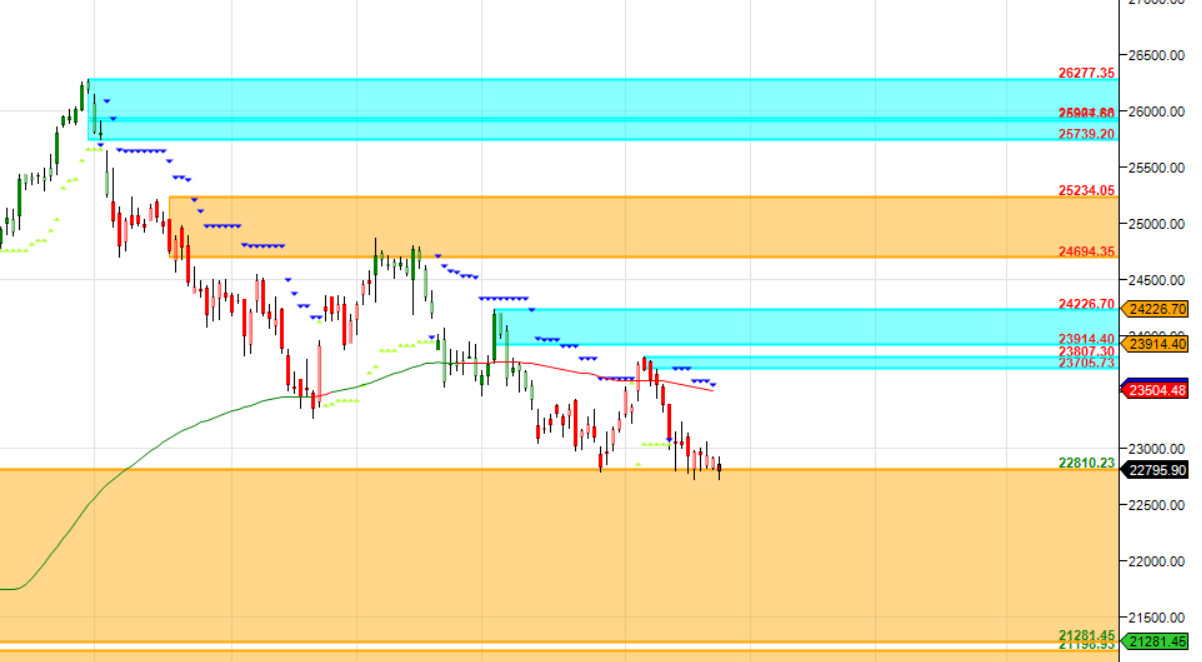
Self Explanatory Chart
Nifty Time Analysis Pressure Dates
11 March is the Important Gann/Astro Date for coming week.
Nifty Weekly Chart
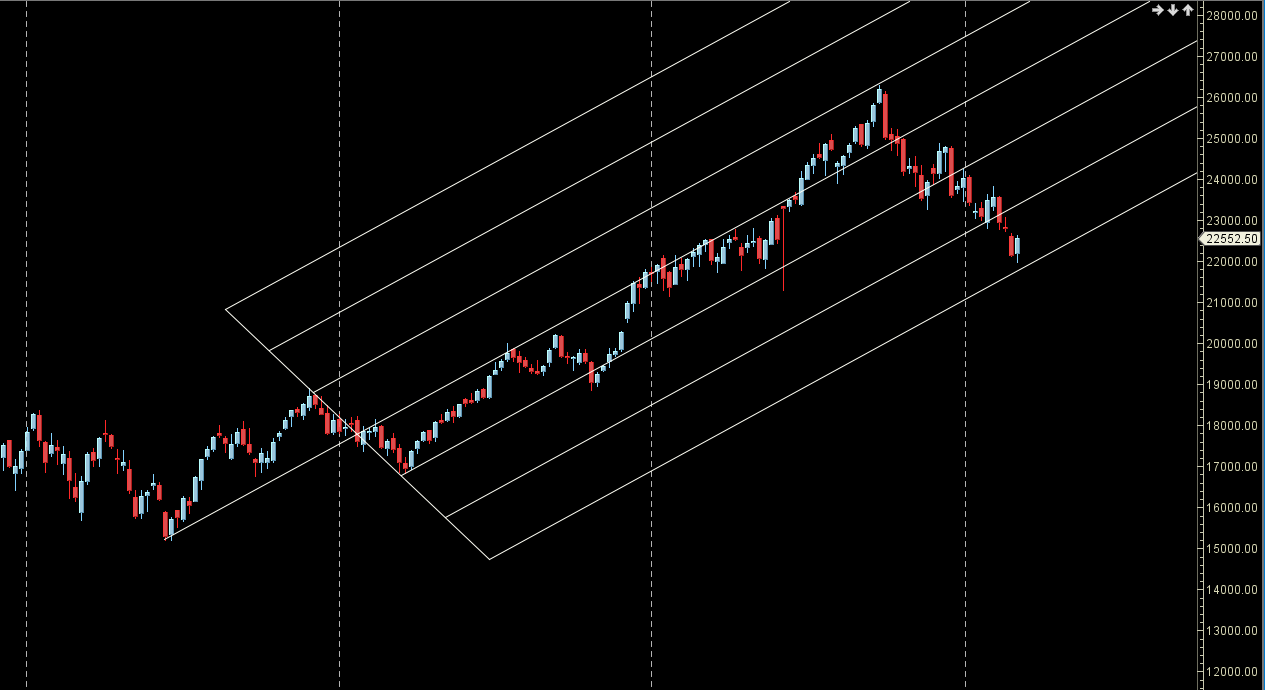
Price bounced from its AF Support zone forming Weekly Hammer
Nifty Monthly Charts
22850 is Monthly resistance zone 22250 is Monthly Support zone.