Foreign Institutional Investors (FIIs) displayed a Bullish approach in the Nifty Index Futures market by Buying 11369 contracts worth 1106 crores, resulting in a increase of 11019 contracts in the Net Open Interest. FIIs bought 13820 long contracts and covered 1445 short contracts , indicating a preference for adding LONG and adding SHORT positions .With a Net FII Long Short ratio of 2.55 FIIs utilized the market rise to enter Long positions and enter short positions in NIFTY Futures.
NIfty after breaking 18888 is on a breakout mode, and trading in Gaps. Yesterday was the 4 gap up, genereaaly its observed 5 gap gets filled in Bull Market. Traders who want to go Short look for this pattern
Today we have “Bayer Rule 15: VENUS HELIOCENTRIC LATITUDE AT EXTREME AND LEAST SPEEDS FOR MAJOR MOVES Imp Rule” “RULE NO. 40 VENUS HELIOCENTRIC LATITUDE DIVIDED INTO PARTS 0*0’ 2*30’ 0*13’ 3*00’ 1*50’ 3*17’ 2*17’ 3*23’” coming into effect, If you are intraday trader watch for first 15 mins high and low to capture the trend.
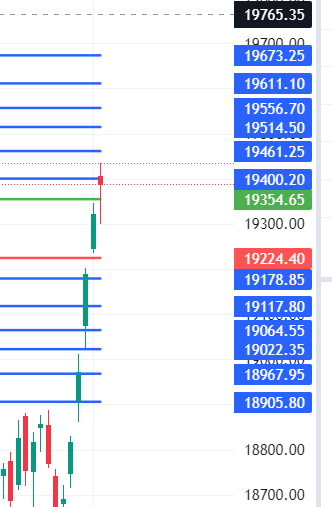
If you are Swing Trader Yesterday High and Low due to Lunar Cycle in very important and we have discussed the trade plan as shown below.
NIfty move like this are one of its kind which we see once in 2-3 years. Nifty has rallied 16828 -19434 till today which is 2606 points and its not an India Specific rally, Markets through out the world are rallying. Rise like these will get nullified by one big red candel which will take atleast 2-3 days of move. So LOng keep tsl below last day low .
For trend to reverse either we will get a Big Gap down or we will form an Outside bar with price closing below previous day low, TIll this conditions are not met trend continues on long side.
Also IF DIP comes in MOrning hours it will get bought into, Fall will come after 2 PM like today.
Tommrow we have Moon at Perigee and Nifty has formed a Hanging Man/ DOJI Pattern first condition of pattern we have discussed here.

Nifty Trade Plan Based Bulls will get active above 19354 for a move towards 19410/19465/19521/19576. Bears will get active below 19224 for a move towards 19168/19113/19057 — Waiting for 19465/19521/19576

Traders may watch out for potential intraday reversals at 9:19,10:03,2:08,2:39 How to Find and Trade Intraday Reversal Times
Nifty July Futures Open Interest Volume stood at 1.03 lakh, witnessing a addition of 0.41 lakh contracts. Additionally, the increase in Cost of Carry implies that there was a adding of LONG positions today.
Nifty Advance Decline Ratio at 30:20 and Nifty Rollover Cost is @18884 and Rollover is at 69.7 %.
Nifty options chain shows that the maximum pain point is at 19300 and the put-call ratio (PCR) is at 0.97 . Typically, when the PCR open interest ranges between 0.90 and 1.05, the market tends to remain range-bound.
Nifty 50 Options Chain Analysis
The Nifty 50 options chain indicates that the highest open interest (OI) on the call side is at the 19500 strike, followed by 19600 strikes. On the put side, the highest OI is at the 19300 strike, followed by 19200 strikes. This suggests that the market participants are expecting Nifty 50 to remain range between 19500-19200 levels.
In the cash segment, Foreign Institutional Investors (FII) bought 2134 crores, while Domestic Institutional Investors (DII) sold 785 crores.
Traders who follow the musical octave trading path may find valuable insights in predicting Nifty’s movements. According to this path, Nifty may follow a path of 18360-18890-19452 This means that traders can take a position and potentially ride the move as Nifty moves through these levels.Of course, it’s important to keep in mind that trading is inherently risky and market movements can be unpredictable. Price has closed above 18890 heading towards 19452 till we are above 18890. High made today was 19434 price is coming near 19452

Fundamental of Trading : 1. Proper preparation 2. Hard work 3. Patience 4. A detailed plan before every trade 5. Discipline 6. Trade Journal 7. Replaying important trades
For Positional Traders, The Nifty Futures’ Trend Change Level is At 19273 . Going Long Or Short Above Or Below This Level Can Help Them Stay On The Same Side As Institutions, With A Higher Risk-reward Ratio. Intraday Traders Can Keep An Eye On 19446 , Which Acts As An Intraday Trend Change Level.
