The year 2020 has been insanely tumultuous: Volatile trading sessions, the shortest bear market, a ferocious bull run, an unprecedented global lockdown, In 2020, we had a bear market, a bull market, a recession, all-time highs (a bubble?). All in the same year.
Yearly Chart

Bank Nifty Yearly chart have formed an Hanging Man Candlestick. 2021 being the 1st Year of the Decade based on past Histrorical data 1st year of Decade we end the Year in the Red as shown in above chart from 2011.
Monthly Gann Chart

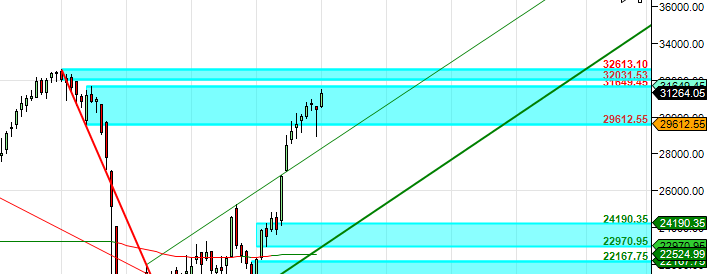
Monthly Chart with Supply and Demand Zone

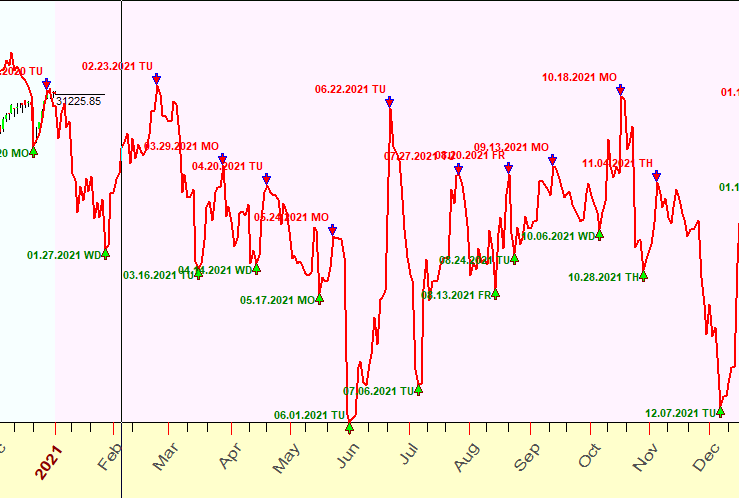
Bank Nifty Projected Price Pattern
Below is Neural Forecast for 2021, It is not a FOOLPROOF Technique and its works 60-65% of time. So Please do not take aggresive trade without SL.

Important Dates as per Time Analysis :
Below dates based on Astro and Gann Techniques can see Trend Change in Market.
04-Jan-21
11-Jan-21
25-Jan-21
18-Feb-21
06-Mar-21
20-Mar-21
16-Apr-21
27-Apr-21
11-May-21
26-May-21
10-Jun-21
23-Jun-21
13-Jul-21
24-Jul-21
16-Aug-21
30-Aug-21
14-Sep-21
26-Sep-21
09-Oct-21
29-Oct-21
05-Nov-21
19-Nov-21
04-Dec-21
21-Dec-21
