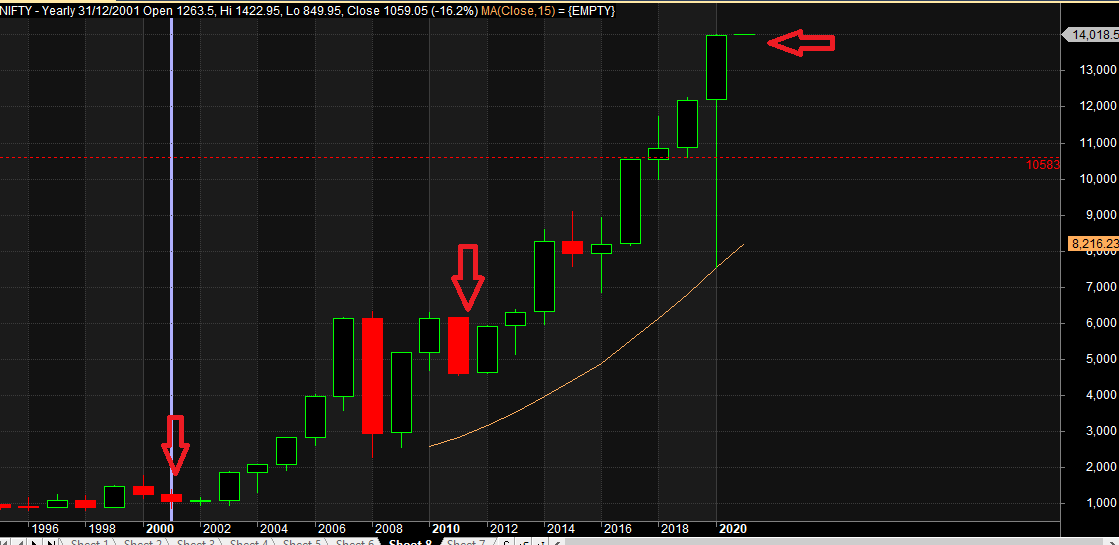
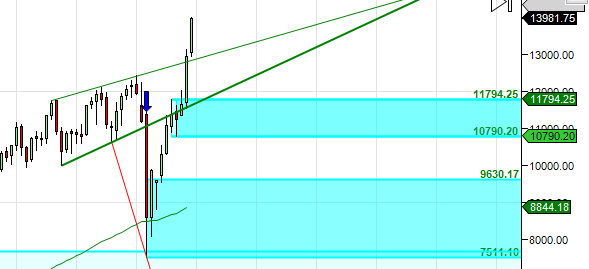
20 Jan 2020 Nifty made Top based on Gann Price Time Squaring and we saw crash in March month towards the low of 7511 on 23 March (Which was our trend change date ) Nifty staged a spectacular rally with US Fed, ECB flooding the system with liquidity and we closed the Year with 15% Gain and closing at all time High. Most of Retail Investors Made money in 2020 as Small and Mid Caps came back in Limelight and many stocks up 3X to 10X from march Lows . Overall a Good Year for Investor and Traders who went with the trend.
Yearly Chart
Yearly chart have formed an Hanging Man Candlestick. 2021 being the 1 Year of the Decade based on past Histrorical data 1 year of Decade we end the Year in the Red as shown in below chart from 2001/2011.

Monthly Gann Chart

Monthly Chart with Gann Angles is shown,till we are holding 10768 rally can extend towards 17251 in extrmeme Bull case.
Monthly Chart with Supply and Demand Zone

Nifty Projected Price Pattern
Below is Neural Forecast for 2021, It is not a FOOLPROOF Technique and its works 60-65% of time. So Please do not take aggresive trade without SL.

Important Dates as per Time Analysis :
Below dates based on Astro and Gann Techniques can see Trend Change in Market.
04-Jan-21
11-Jan-21
25-Jan-21
18-Feb-21
06-Mar-21
20-Mar-21
16-Apr-21
27-Apr-21
11-May-21
26-May-21
10-Jun-21
23-Jun-21
13-Jul-21
24-Jul-21
16-Aug-21
30-Aug-21
14-Sep-21
26-Sep-21
09-Oct-21
29-Oct-21
05-Nov-21
19-Nov-21
04-Dec-21
21-Dec-21

Bramesh…you are doing an amazing job but a couple of key requests
1) can you please add a scale to the vertical index on the all important graph under the section – Nifty Projected Price Pattern ….for example, without the vertical index, I can’t find, how low we go to on 26th Jan
2) pl put approximate values of nifty against the dates under – Important Dates as per Time Analysis :….
Thanks a ton and keenly looking forward to your update
We removed it intentionally as it creates confusion among readers
Sir, please clarify on which chart i.e (daily/weekly/monthly) if 14081 is not sustained decisively, that we can conclude it will lead to Nifty Yearly Trend Change? Thanks
yes sir
Sir , nifty prediction pf 26 January of 8000 . Does that signify a big fall .. ? Nifty original movement does not match with past gann prediction so how should we read the chart. Please guide.