Last week we gave Chopad Levels of 7815 , long taken as per Chopad levels got rewarded with 240 points as Nifty did all 3 targets on Upside as High made was 8055 which as 1 point short of our 3 target of 8056. We have trading Holiday on 25 Sep. Lets analyze how to trade market in coming week.
Nifty Hourly Chart

Nifty hourly EW chart shows if 8055 is not broken we can see downmove till 7800 in coming week.
Nifty Hourly Gann Box

Nifty is near an important gann support line unable to cross can see downmove till 7948/7850 in coming week.
Nifty Pyrapoint

Got Resisted @ 135 degree heading towards 180 @7928 and below that 7800.
Nifty Supply and Demand

Supply Demand zone caught top @8055 as shown by Blue arrow bow break of 7958 and close below it for 2 days can see nifty going down till 7767.
Nifty Harmonic Analysis

As discussed last week bounced till 8055 Nifty as per Harmonic Analysis has formed Butterfly pattern if 7563/7550 is held nifty can boucne back to 8050/8200 odd levels.
Nifty Gann Date
Nifty As per time analysis 21 September/24 Sep is Gann Turn date , except a impulsive around this dates. Last week we gave 15 September/18 Sep Nifty saw a volatile move .
Nifty Gaps
For Nifty traders who follow gap trading there are 15 trade gaps in the range of 7000-9000
- 7067-7014
- 7130-7121
- 7276-7293
- 7229-7239
- 7454-7459
- 7526-7532
- 7598-7568
- 7625-7654
- 7780-7856
- 7927-7940
- 8174-8195
- 8091-8102
- 8322-8372
- 8355-8381
- 8937-8891
- 7829-7853
- 7900-7955
Fibonacci technique
Fibonacci Retracement

7965 /7917/7802 should be watched in coming week.

Touched the high of Fibo Fan and retraced back.
Nifty Weekly Chart

It was positive week, with the Nifty up by 192 points closing @7981 , and closing below its 55 WEMA and 20 WEMA and held its trendline support as shown in above chart. We are entering new time cycle from coming week.

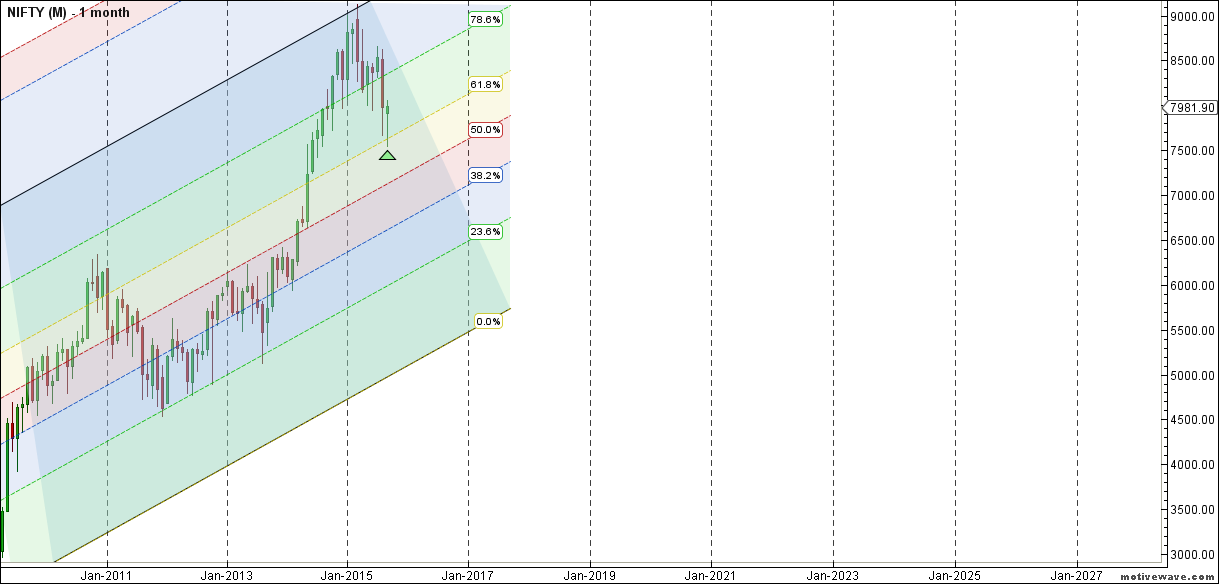
Trading Monthly charts

Monthly chart took support @61.8% retracement line and showed bounce back.
Nifty PE

Nifty PE @22.12 , so at last seeing some correction in valuation
Nifty Weekly Chopad Levels
Nifty Trend Deciding Level:7930
Nifty Resistance:8000,8075,8130
Nifty Support:7855,7810,7766
Levels mentioned are Nifty Spot
Let me go by Disclaimer these are my personal views and trade taken on these observation should be traded with strict Sl.Please also read the detailed Disclaimer mentioned in the Right side of Blog.
Want to see post in your Inbox,Register by adding your email id in Post in your Inbox section
Follow on Facebook during Market Hours: https://www.facebook.com/pages/Brameshs-Tech/140117182685863

Structure of Market set up now is for Real professionals to trade.Nifty is going to breach immediate previous lows of 7540 on spot levels and head lower in October series.Ideal shorting zone is 8173-8213.This time market might not stop at 7500 levels as ultimate tgt for H&S pattern on weekly chart is 7000 spot levels which should get achieved max by November series.Also Change in lot size for futures from November series will do no good for markets as minimum lot size will be 75 instead of 25 from November series.
Hi Bramesh, new time cycle will be bullish or bearish?
great analysis sir. hats off!
as you have mentioned that we are entering a new Time Cycle from this week onwards , what does it signify (BULLISH/BEARISH) and till when will this cycle go on , i mean till which month ? as per the chart it says march2016, is it true?
thank you!