Last week we gave Chopad Levels of 8806 , Nifty did 3 target on downside and got stopped out on upside. Lets analyze how to trade market in coming week.
Nifty Hourly Chart

Nifty Hourly charts has broken on downside and below its 21/34 EMA, till 8682/8690 is not broken trend remains on downside.
Nifty Hourly Elliot Wave Chart

8596 will play a vital role in coming week, close below can see 8489/8400 and above it nifty can move to 8850/8900 range.
Nifty Pyrapoint Analysis

As per Pyrapoint Analysis unable to sustain above its 135 degree line, suggesting move towards its 180 degree line which lies near 8525.
Nifty Market Profile

Nifty as per Market profile 8596 should be closely watched in coming week, Holding the same rally continues till 8682/8750 . Breaking the same can see pullback till 8497
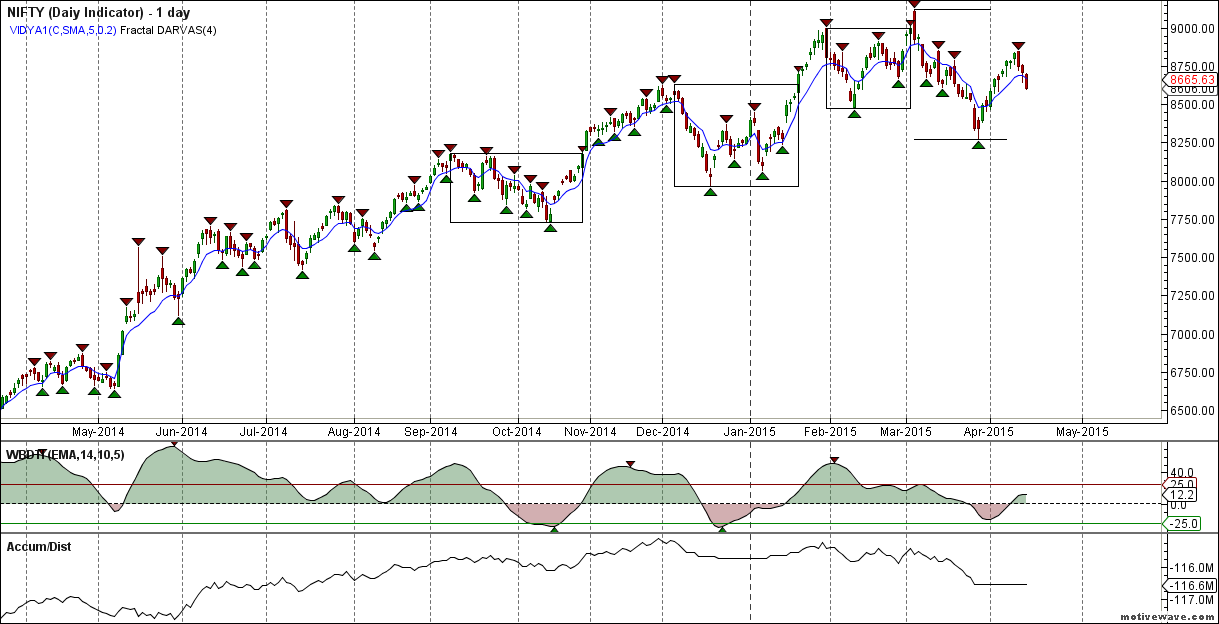
Nifty Daily

Nifty fractal which are swing high an swing top are shown in above chart.Also we have included indicator which defines bulls and bear trend, As of now trend is down till 8665 is not broken.
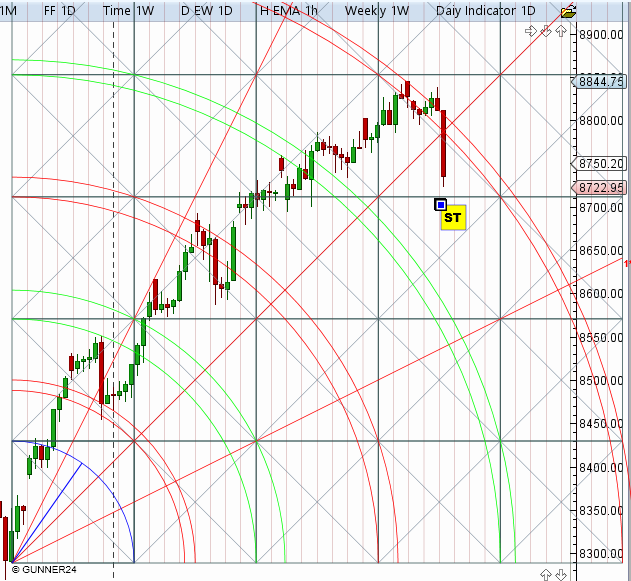
Nifty Gunner

ON Daily chart Nifty Gunner bouned from red arc and took resistance at green arc. Close below 8596 can make move towards 8489/8400.
Nifty Harmonic

This is what we discussed last week As per harmonic pattern if 8793/8820 not crossed we can see correction till 8640/8650 odd range.
If butterfly pattern needs to form Nifty should bounce sharply in coming week till 8800.
Nifty Daily Elliot Wave Chart

As per EW more legs are left to the rally use dips around 8200/8165 to take exposure to quality large and mid caps stocks. NO leveraged positions this for cash market traders.
Supply and Demand Zone

Self Explanatory chart for Supply and Demand zone.
Nifty Gann Date
Nifty As per time analysis 20 April/23 April is Gann Turn date , except a impulsive around this dates. Last week we gave 13 April/15 April Day and Nifty saw a volatile move on both the days .
Nifty Gaps
For Nifty traders who follow gap trading there are 14 trade gaps in the range of 7000-9000
- 7067-7014
- 7130-7121
- 7276-7293
- 7229-7239
- 7454-7459
- 7526-7532
- 7598-7568
- 7625-7654
- 7780-7856
- 7927-7974
- 8029-8065
- 8378-8327
- 8102-8167
- 8341-8380
- 8706-8699
- 8937-8891
Gann Emblem

Fibonacci technique
Fibonacci fan

Nifty near its Fibo fan support so next week we need to see do we get the follow up move.

8489 is 61.8% retracement number so keep a eye on this.
Nifty Weekly Chart

It was negative week, with the Nifty down by 174 points closing @8606 , and closing above its 20 WSMA and also trading near its weekly channel. As per Gunner pattern if Nifty breaks 8568 we might head towards 8520/8434 odd levels.


Trading Monthly charts

Monthly chart took support near 23.6% retracement line and also low of 8464 will play a major role in coming month.
Nifty PE

As per PE ratio has again up to 23.06, Result season is going to start unable to upgrade the earning can see nifty moving in bubble category.
Nifty Weekly Chopad Levels
Nifty Trend Deciding Level:8596
Nifty Resistance:8682,8768,8854
Nifty Support:8520,8434,8360
Levels mentioned are Nifty Spot
Let me go by Disclaimer these are my personal views and trade taken on these observation should be traded with strict Sl.Please also read the detailed Disclaimer mentioned in the Right side of Blog.
Want to see post in your Inbox,Register by adding your email id in Post in your Inbox section
Follow on Facebook during Market Hours: https://www.facebook.com/pages/Brameshs-Tech/140117182685863

Sir pls allow right click for better understanding
Dear Sir,
V can’t zoom in the charts…….Pls help us………..
Try Now .
Rgds,
Bramesh
Yes guruji even I think it is interchange
Thanks a lot !! Its corrected.
Rgds,
Bramesh
Sir nifty resistance and support lvls are interchanged