Last week we gave Trend Deciding level as 5720 Nifty achieved 3 weekly targets on upside made exact high at 3 weekly target of 5852 🙂 and 2 target achieved on downside.Hope traders are able to mint money on both sides. This is what i have said last week analysis Its has been observed for historical data Nifty rallies swiftly after 5 week of correction and this being an expiry week. So traders carrying short are advised to book out shorts and go long above Weekly trend deciding level. I have been an advocate of booking shorts from past 2-3 sessions and hope no traders reading analysis were stuck up with shorts.
Nifty Hourly Chart
Nifty Hourly charts is now trading in a trendline crossover zone with negative divergence in RSI,MACD, Expect sideways to choppy move in coming week.
.Range of 5550-5605 is very crucial range in Nifty as there are cluster of support in this range. Any pullback from this range will be sharp and swift. Again discussed last week:)
Nifty Gaps
For Nifty traders who follow gap trading there are 1 trade gaps in the range of 5400-6000 and all other gaps got filled.
- 5878-5868
- 5588-5630
- 5682-5749
Nifty Daily Chart
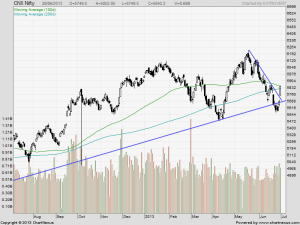
On Daily chart closed above 200 DMA on weekly basis,and also after consolidating near its trendline support of with rSI showing positive divergence, gave the much expected bounced. Close above 100 DMA @5852 will propel nifty towards 5950 odd levels.
Fibonacci technique
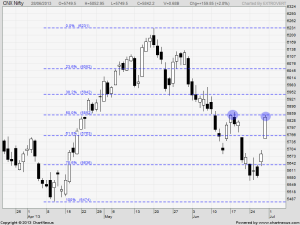
As per of Fibo Retracement theory Nifty took resistance at 5852 which is 50 % retracement from 5474-6229. Holding above 5852 further bounces can be expected till 5950 odd levels.
Fibonacci fan
Nifty Fibonacci fan are wonderful tool to find the top and bottom in short term.Another week of consolidation around Fibo fans. Decisive move should come next week. This we discussed last week and we saw a decisive move happening. We never knew how global markets will react but price gave us an indication well in advance 🙂
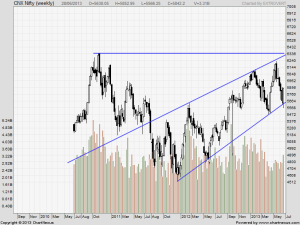
Nifty Weekly Chart
Trading Monthly charts
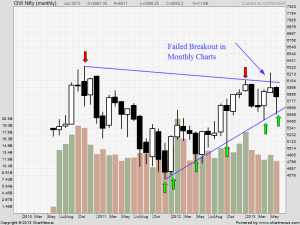
Monthly charts after forming a topping tale formation in May month are now forming Hammer Candlestick formation which is bullish in nature as it took exact support at monthly trendline and gave a bounce-back.
Nifty Trading Levels
Nifty Trend Deciding Level:5869
Nifty Resistance:5920,5972 and 6028
Nifty Support:5764,5720 and 5676
Levels mentioned are Nifty Spot
Stock Performance sheet for June Month is updated on http://tradingsystemperformance.blogspot.in/
Let me go by Disclaimer these are my personal views and trade taken on these observation should be traded with strict Sl
Want to see post in your Inbox,Register by adding your email id in Post in your Inbox section
Follow on Facebook during Market Hours: https://www.facebook.com/pages/Brameshs-Tech/140117182685863


Hi Brahmeshji
you said you could gues about decisive move with the help of price movement of stock or Nifty BUT ON WHICH SIDE MOVE IS EXPECTED WAS NOT TOLD . SO WHAT SHOULD BE CONCLUDED?
SO I NEED TO KNOW THAT WHAT PRICE WAS INDICATING YOU ?
I AM REGULAR READER OF YOUR BLOG SINCE LAST 3 YEARS. WHEN I CAME TO KNOW
THANKS
Dear Rajuji,
I always give levels to trade on. Decisive move means we will get a big rally as seen last week, as soon as Nifty opened above trend deciding level of 5720 its just moved up and achieved the 2 tgt of 5852.
Rgds,
Bramesh