


As Discussed on 13 May :At last INR reaches our target of Rs 60. Lets analyze USD INR technical for coming week, do we have more steam for the rally to continue further.
USD INR 4 Hour Chart
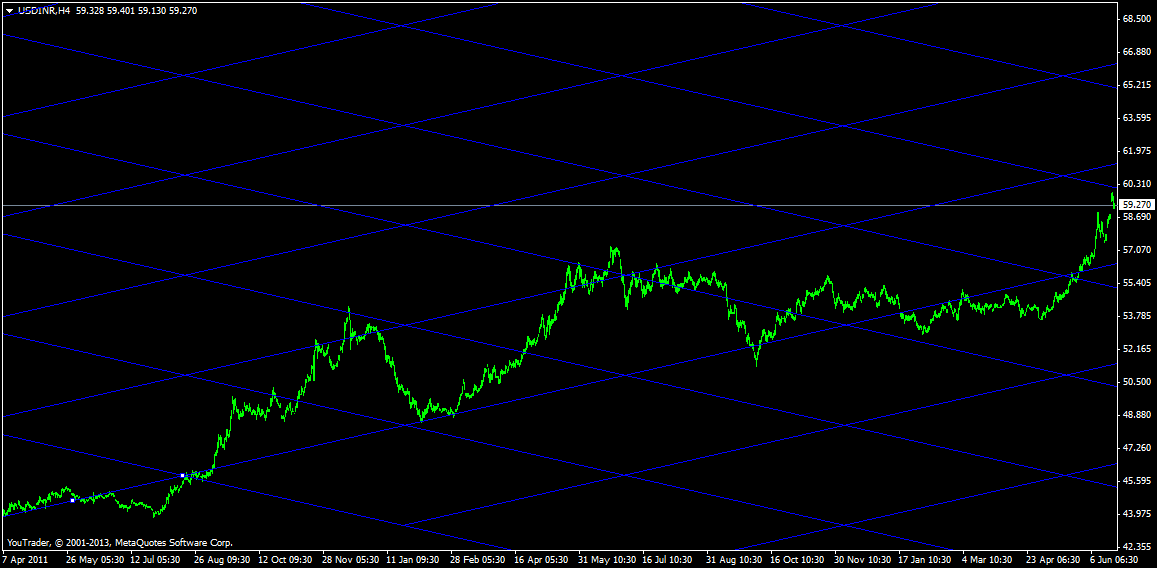
USD INR 4 hour chart as per Gann Grid looks like topping out formation in near term. It has taken resistance at Gann Grid and started its pullback . Close look at chart suggests most of times it touch the upper end of grid its given pullback till lower end which right now is @57.5
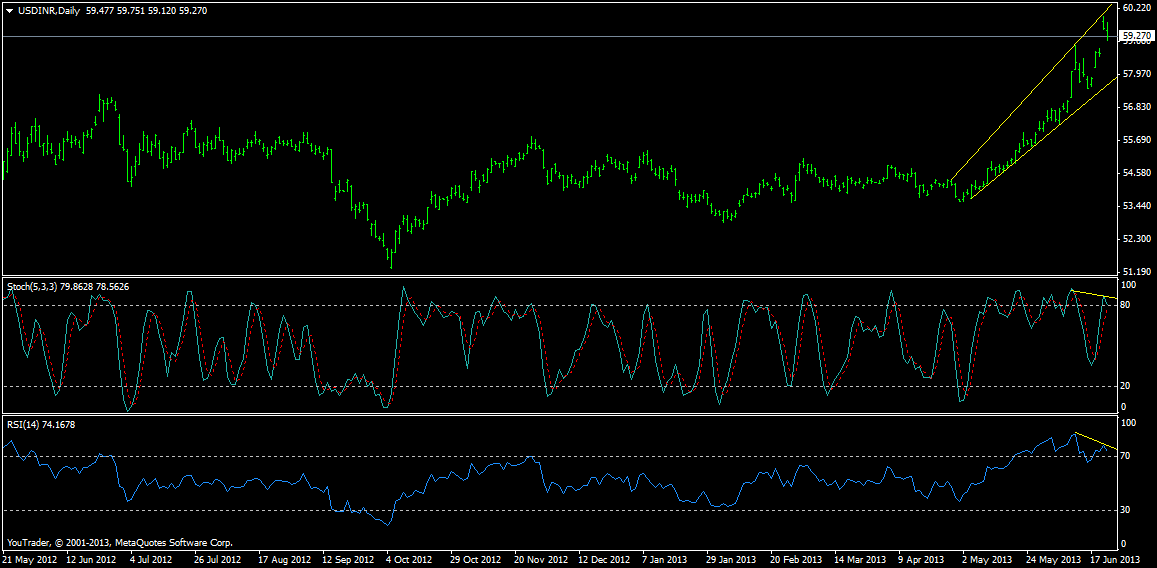
USD INR Daily Chart
As per Daily charts IN is forming rising wedge pattern which is bearish in nature, Negative divergence are visible in RSI and Stoch. Unable to cross 60 on Spot rupee can see a slide near 58-57.5 odd levels in medium term.
USD INR Weekly Chart
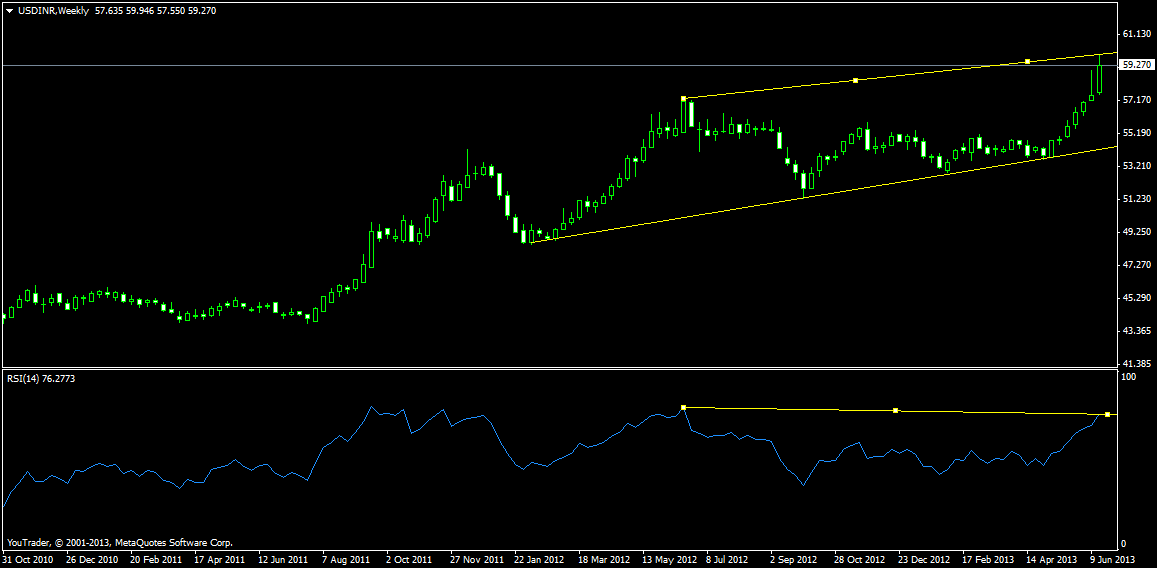
Weekly charts Rupee is trading at channel top with negative divergence in most of indicators. Unable to cross above the Last Week high will ensure a pullback.
USD – INR Trend Deciding Level:60.10
USD – INR Resistance:60.73,61.21 and 61.83
USD – INR Support:59.18,58.50 and 58.08
Levels mentioned are USD – INR June Future
Follow on Facebook during Market Hours: http://www.facebook.com/pages/Brameshs-Tech/140117182685863