


Last week was one of the most dramatic week in recent time with Sensex plunging 400 points on Monday and recovering and positing a spectacular 500 points rally and closing Market above 28 week high. Standard and Poor affirming India’s sovereign rating at BBB- and saying that there was one in three chance of a rating downgrade over the next 12 months did not affect the market mood.Next week SBI, L&T results this week.So lets see how to approach nifty trading for next week.
Last week we gave Trend Deciding level as 6120 Nifty achieved 1 weekly targets on upside and all 3 downside triggered.
Nifty Hourly Chart

Nifty Hourly charts is now facing resistance at upward rissing trendline as shown in above chart.Nifty has entered a new trading zone of 6150-6200 and has been trading in the range from last 2 trading days. Tull 6120 is not broken bulls are having upperhand.
Nifty Gaps
For Nifty traders who follow gap trading there are 1 trade gaps in the range of 5400-6000 and all other gaps got filled.
- 5836-5853
- 5477-5446
- 5995-6018
Nifty Daily Chart
On Daily chart Nifty is trading in perfect up trending channel and Monday fall took support at the channel bottom and we saw a rally. 6120 which was breakout point remains the bone of contention between bulls and bears.Now we are nearing next important resistance zone of 6220-22 range closing above it NIfty will head towards life high of 6336
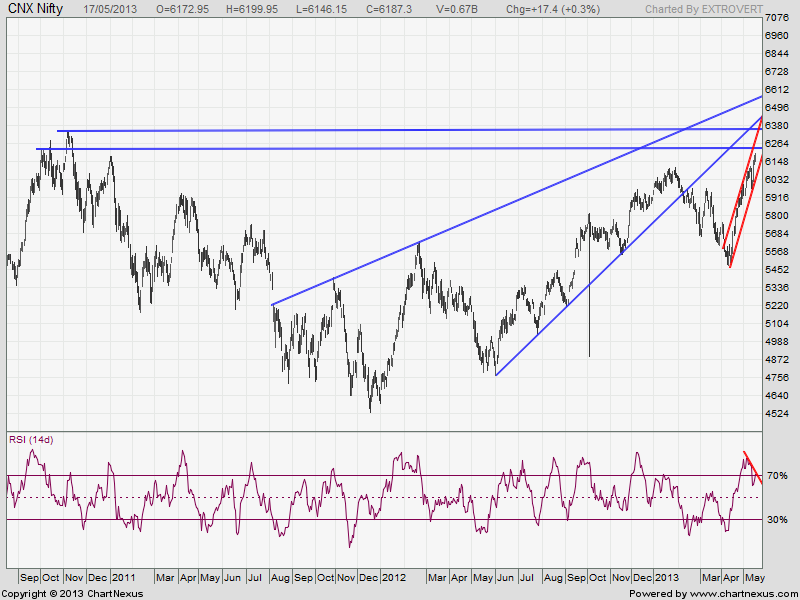
Fibonacci technique

Nifty Fibonacci fan are wonderful tool to find the top and bottom in short term.Last Week Nifty daily chart took exact support at Fibo Fans and bounced back as expected and in current week Nifty took exact resistance at Fibo Fans resistance. Nifty closed above Fibo resistance level and now follow up action is required for target of 6428 as per Fibo Fans.
Fibo Retracement
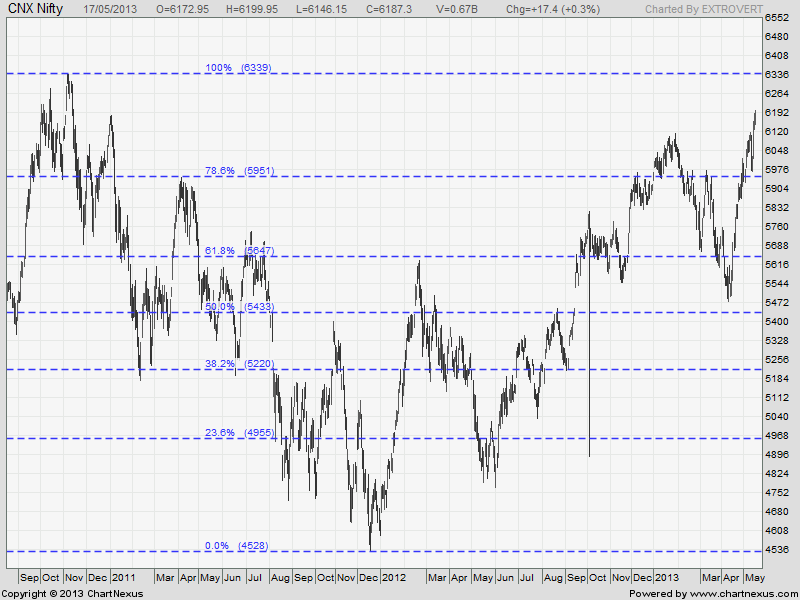
As per of Fibo Retracement theory Nifty took out at 8%0 retracement of 4531-6336. Now range of 5950-6000 is an important support zone.Above 6120, 6336 is next logically target.
Nifty Weekly Chart
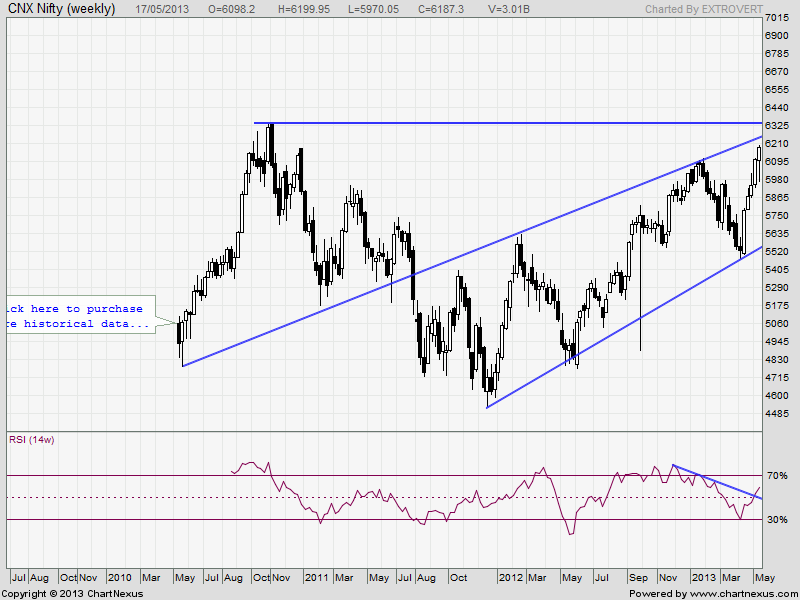

Trading Monthly charts

Monthly charts have given a breakout, we need to wait for monthly closing for confirmation. But ride the move till music lasts 🙂
Nifty Trading Levels
Nifty Trend Deciding Level:6222
Nifty Resistance:6268,6310 and 6350
Nifty Support:6150,6001 and 5960
Levels mentioned are Nifty Spot
Let me go by Disclaimer these are my personal views and trade taken on these observation should be traded with strict Sl
Want to see post in your Inbox,Register by adding your email id in Post in your Inbox section
Follow on Facebook during Market Hours: https://www.facebook.com/pages/Brameshs-Tech/140117182685863
6301 is the ultimate destination for nifty in next week.