As discussed on 10 Apr Gold technical analysis Gold is trading near the upper resistance zone 1588-1590$. Unable to break the 1590$ pullback till 1560-62 should be expected which it did the same day. Today after retail sales unexpectedly dropped commodities are having sell off. Also as per Gold technical analysis before crucial Jobs data we clearly mentioned 1526 as strong support and break of same lead to panic in Gold and lead the biggest one day decline in recent history Lets analyses whats in store for coming week
Gold Daily
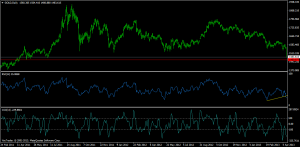
 As per daily charts gold has broken the 2 year strong support of 1526, had a panic fall, Gold made a panic low of 1580$, Next important level of support comes at 1562. RSI has broken its rising trendline spells more trouble for Gold BULLS,CCI is showing positive divergence but we need a close above 1506 on daily basis for trend to change.
Gold Weekly
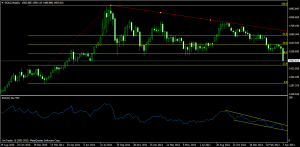
As per Weekly charts drawing the Fibo retracement from 2011 low of 1308 till the recent high of 1920, 1445 comes as 23.6% retracement. So we can see some pullback from this range. RSI is also taken support of downward falling channel signalling pullback. Positional Traders can use the below mentioned levels to trade the coming week.
Gold Trend Deciding Level:1505
Gold Resistance:1517,1536 and 1550
Gold Support:1462,1443 and 1427
Levels mentioned are Gold Spot
Silver Daily
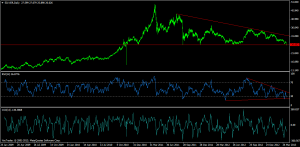
Silver unlike gold was able to hold and close above 2 year support of 26$. Silver Daily chart is forming a huge descending triangle with trigger point at 25.8.
Silver Weekly
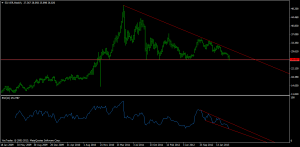
As per Weekly charts Silver is nearing very important 2 year support of $26 which has resulted in swift pullback last 3-4 times. Trend is Sell on Rise keeping strict SL of $28.Positional Traders can use the below mentioned levels to trade the coming week.
Silver Trend Deciding Level:26.66
Silver Resistance:27.44,28.05 and 28.81
Silver Support:25.30,24.50 and 23.11
Levels mentioned are Silver Spot
Follow on Facebook during Market Hours: http://www.facebook.com/pages/Brameshs-Tech/140117182685863


