Bears kept ruling the Dalal Street for 4 week in row as Sensex and Nifty closed at 2013 low, with Nifty closing with cut of 0.6%, .Next week stocks will sway as per FM talks as he will present the most waited event the Union Budget on 28 Feb Railway Budget of 26 and Economic Survey on 27 will be tabled in parliament. To add spice to trading its the expiry week also, So Bumper Dhamkha and rise in volatility will be seen. As per Last week Analysis Nifty moved above Weekly trend deciding level of 5915 makes the exact high at 5970 which is first resistance turned back and went till support 2 of 5830
Lets discuss Nifty Trading Strategy for Next week.
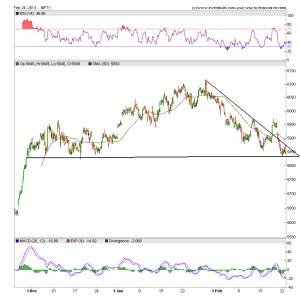
Nifty Hourly Chart
Nifty is trading below 50 SMA which lies at 5893. On Hourly charts Nifty is forming a descending triangle with breakout below 5815. One good thing happened in recent correction is it took away excessive enthusiasm from market participant thinking it will be a bumper Budget, expectation are at all time low and even if we have a so so budget market can rally.
Nifty Gaps
For Nifty traders who follow gap trading there are 1 trade gaps in the range of 5700-6000. Most of the gaps have been fulfilled in current correction only 1 is reaming
- 5727-5736
- 5921–5943
Nifty Daily Chart
T.As seen in below chart Nifty after having broken the 8 months old Trend line green color which it was holding from the low of 4770 on both weekly and daily basis, has now become the resistance, so the brief upmove we saw in the last week took resistance at trendline and nifty pulled back, Resistance become Support as per classical technical analysis.
If we draw a trendline from low of 4531 Nifty seems to be holding that line for the time being. 5815-5840 range will be a crucial support for nifty next week holding the same rally can happen till 5950,unable to hold the same fall till 5600 can happen in panic.
Nifty Daily Chart with Indicators
Positive Divergence can be seen in Daily charts in RSI and Stochastic as seen in above chart. So bounce back should be expected from 5838-5815 range. Traders carrying shorts better to do profit booking in the range.
Fibonacci technique
As discussed earlier Fibonacci fan helps in finding potential tops and Bottom of market from short term prospective.We have used Weekly chart and applied Fibo Fans, Nifty was able to close below the Fibo Fans support of 5880 which is negative signs for Bulls, Next level of support comes at 5775
Fibo Retracement
Bulls market tend to bounce from 50% retracement level,As seen in above chart Nifty has previously bounced back from the 50% retracement from 5547-6112 which is at 5830. We made the low of 5835 on Friday, so till 5830-5815 range is held bounce back should come.
Nifty Weekly Chart
Trading Monthly charts
Monthly chart declined after taking resistance at 6112. Till Nifty does not cross 6034, Monthly charts will remain bearish.
Nifty Trading Levels
Nifty Trend Deciding Level:5882
Nifty Resistance:5921,5961 and 6027
Nifty Support:5815,5775 and 5740
Levels mentioned are Nifty Spot
Let me go by Disclaimer these are my personal views and trade taken on these observation should be traded with strict Sl
We do discussion is Live market to update Nifty levels If you are interested you can LIKE the page to get Real Time Updates.
Follow on Facebook during Market Hours: https://www.facebook.com/pages/Brameshs-Tech/140117182685863


I am just wondering whether nifty formed head and shoulder pattern in daily charts.
Hi Hari,
I do not see any reliable HnS formation
Rgds,
Bramesh