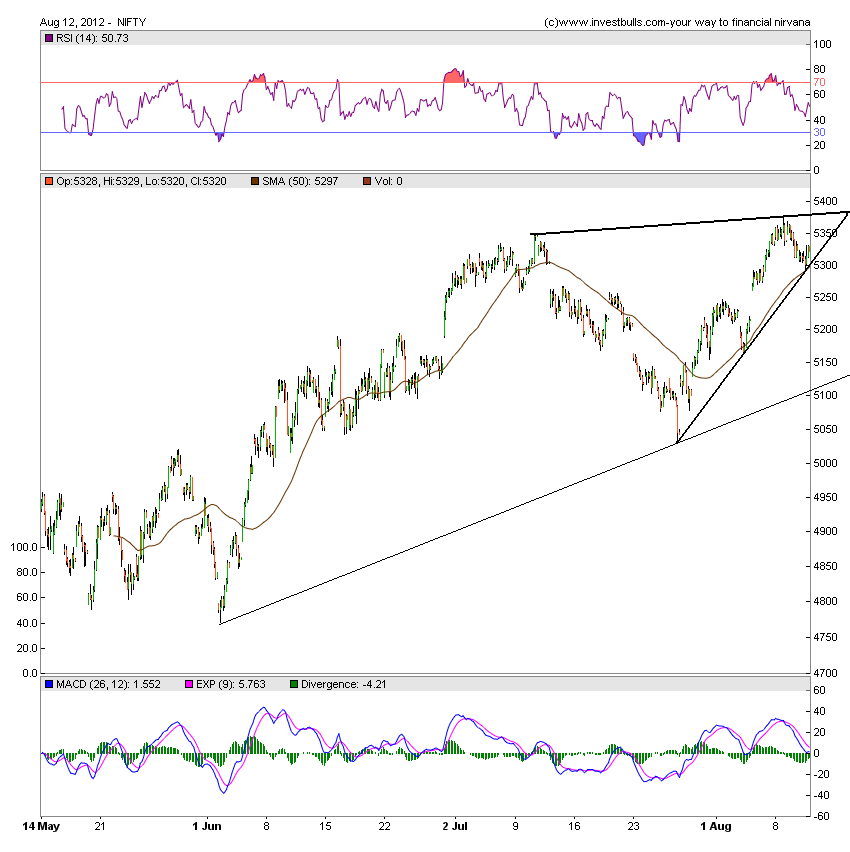
Nifty is defying that Gravity exists with each small dips is getting bought into(Well it goes with our analysis),but if you look at the internal of market Nifty is driven higher with few stocks namely HUL,ITC and RIL. Bharti Airtel and State Bank of India have broken down after results. So we have market rising on few stocks and poor market breadth and deteriorating fundamentals of Indian economy as Many prominent brokers have cut the GDP target of Indian Economy. But due to ample liquidity present Nifty is not breaking down. So go with the trend till the music lasts , Many trades want to short have shorted Nifty based on above facts but do not be impatient lets the signal emerge till than either be on sidelines or be on long side. Coming week is Holiday shortened week as we have Holiday on 15 August.
Nifty Hourly Chart
Nifty Hourly Charts are forming ascending triangle with breakout above 5380 NS.Support now exists at 5282. Till Nifty is trading above 5297 which is 50 Hour SMA bullish momentum is intact.
Nifty Gaps
Nifty has formed the following 2 gaps in the range of 5077-5350
- 5216-5260
- 5043-5077
So these levels should be noted down carefully to find further support and resistance.
Nifty Daily Chart
Bulls were able to close above 5300 on weekly basis with a breakout above 5267.Range for Nifty is getting narrower each passing day,breakout above 5380 and breakdown below 5284 is on the verge of happening.
Nifty Spot trading channel in a channel gave a breakout above it and also took support on Friday with low if 5294. MACD is in BUy mode,RSI at 75 and Stochastic on verge of giving a SELL. Resistance have become support. So range of 5284-5294 is cluster support for market.
Nifty Fibo Retracement
Nifty Fibonacci Retracements from 4770-5350 are drawn in above chart,Closer look at the same gives that Nifty has been consolidating in the range of 50% retracement at 5199 and 61.8% retracmenet at 5301.Last week we consolidated in the range of 5301-5350. Till we are closing above Golden Ratio of 61.8% Bullish momentum is intact.
Nifty Weekly Chart
Nifty tried to breakout of falling trendline but unable to close above 5380, Also 100 WDMA of Nifty comes at 5386 so range of 5350-80 remains crucial on Weekly closing basis.
Nifty Monthly Chart
Close above 5217 is bullish for market for rest of year.Monthly Charts of Nifty is giving resistance at 5380 break of same will lead to a move till 5445.Support on Monthly charts comes at 5234
In Nutshell:Daily charts are giving a Sell on Rise sign till 5380 is not broken,Weekly charts are signalling Buy on dips with sl 5284 and Monthly chart closed above 5217 signalling August series to be bullish. So trade on time frame you follow ie. Daily,Weekly or Monthly
Range of 5267-5310 is a crucial range,Bulls unable to capture the same will lead to bears attacking and taking upperhand.
Nifty Trend Deciding Level:5380
Nifty Resistance:5438,5460 and 5500
Nifty Support:5260,5216 and 5164
Let me go by Disclaimer these are my personal views and trade taken on these observation should be traded with strict Sl
We do discussion is Live market to update Nifty levels If you are interested you can LIKE the page to get Real Time Updates.
Follow on Facebook during Market Hours: http://www.facebook.com/pages/Brameshs-Tech/140117182685863


