Today is the auspicious day of Lord Shiva
Celebrate it with joy of heart and help people understand the values of Lord Shiva.
Happy Maha Shivratri to all Site Readers
The Glorious Bull run continues in Indian markets with Nifty completing 1000 points in matter of 40 trading sessions. So what all we lost last year have been recovered in 44 days only in 2012. Central Bank (ECB,FEd and BOJ) who have flushed the market with liquidity subsequently Bull rally has gripped the stock market and driven the averages up in an almost straight line since mid January.
So will the Stock Market keep going up defying the law of gravity, Let try to analyze it using both fundamental and technical view.
Macro View:
The fundamentals remain a matter of concern.
- Q3 results have shown continued downward pressure on margins of India Inc.
- The fiscal deficit will end up much higher duw to rising crude oil prices and Food for Security act by GOI
- Interest rates remain high.
- Inflation has been low due to high base effect and will rise again from next 2 month onwards when we face the ground reality.
- A Greek sovereign default hasn’t been ruled out.
- War with Iran can let the Crude Oil spiking higher. Yesterday Iran has stopped giving oil to EU countries and Oil is trading at 6 months high.
Technical Perceptive
Nifty Hourly Chart
On Hourly charts Nifty gave a breakout after consolidating in the range of 5320-5428 with 50 Hourly moving average providing a good support. Friday was a gap up opening but unable to sustain above 5600.
On Hourly charts shown above i have pointed all the 6 Gaps which have been left unfulfilled from the rise of 4640-5606 on Nifty Spot. For a healthy rising markets such gaps needs to be filled for a healthy bull market..
1 Gap :4641-4676
2 Gap:4744-4772
3 Gap:4879-4905
4 Gap:4947-4991
5 Gap:5416-5460
6 Gap5521-5545
Keep watch on above levels as Gap provides an excellent trading opportunities.
Nifty Daily Chart
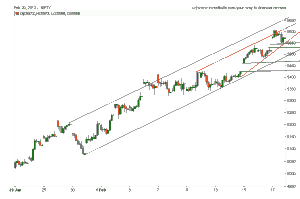
 On Nifty daily chart nifty has been trading in a channel after it did a 7 days of consolidation in the range of 5320-5428 as shown in above chart.Till nifty keeps trading in a channel the current upmove will continue. Break of channel comes at 5484. Volumes are very high there is range of supply and Nifty forms a top near this range it can be considered as distribution by professional traders and investors.
 T- Profile forming in Nifty with nifty taking resistance at the top. Next resistance comes in range of 5680-95 range so this levels needs to be watched closely.
Nifty daily Chart with Indicator
Any Indicator you take is overbought and with negative divergence but that’s the beauty of trending market. Price should show weakness before taking any short trade. NO resistance holds in Bull market. SO blindly do not short nifty just looking at the overbought nature of market,lets gets the confirmation from price.
Nifty Fibonacci
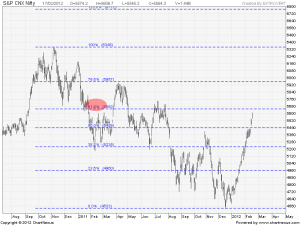
 Nifty is approaching the golden ratio at 5652 from high of 6333 to low of 4532. Traders who are holding shorts keep Stop loss of 5652 on closing basis.
Nifty Weekly Chart
 As per weekly charts Nifty is approaching supply zone of 5652-5710 which is where nifty can form a potential top. This range should be used to ligten long term commitments and short term delivery position and reenter again at dips.
As the rise have been one sided the fall will also a waterfall decline if and when it comes. Further i would add Stock markets move on their own logic – there is no point in trying to second-guess the market.
Nifty Monthly Chart
As per Monthly chart again its pointing to supply zone of 5710 odd levels.
So, for now, caution is warranted but outright bearish aggression not advised.
Volume Based Profile

Nifty Trend Deciding Level:5614
Nifty Resistance:5652,5710 and 5755
Nifty Support:5522,5484 and 5428
Let me go by Disclaimer these are my personal views and trade taken on these observation should be traded with strict Sl
We do discussion is Live market to update Nifty levels If you are interested you can LIKE the page to get Real Time Updates.
Follow on Facebook during Market Hours: http://www.facebook.com/pages/Brameshs-Tech/140117182685863


Hello sir I realy appreciate of ur hard work. I would like to learn all parameters can u help me?
Dear Sir,
I have sent you details of my TA course i conduct,Please go through it and let me knw if you are interested we can move further on it.
Rgds,
Bramesh
thanks and regards, clicked on all 3 ads.
Thanks a lot sir. Kind Request please click on 1 add only that to in a Week.
Thanks again !!
Rgds,
Bramesh
nice analysis, see call of 5500 of march at 248. ?sell .
jan high 5217 low 4588 fib retracment 1.618 = 5606 exactly market make high. your expert view.
Yeah looks perfect sir
Rgds,
Bramesh
Thanks A lot for education YOU are providing to learn the market.with regards,
Thanks a lot Sir…
Rgds,
Bramesh
thanku sir ,,
we will be very cautious
Wishing you a profitable trading week ahead….
Rgds,
Bramesh