Nifty had a fantastic start of year up 12.6% till date rising on back of equity buying by FII and value buying seen by HNI and retailers.
FII has pumped in 8000 cores in Jan Month alone,One of the biggest buying streak seen in recent times. Next week will be an interesting trading week as Nifty is approaching the crucial 200 DMA zone .
Last week we discussed Nifty Trend deciding level as 4995 is bound to move up and same happened this week with Nifty made a high of 5217 just 3 point short of our final target 5220
Nifty Hourly
On Hourly charts shown above i have pointed all the 5 Gaps which have been left unfulfilled from the rise of 4640-5217 on Nifty Spot. For a healthy rising markets such gaps needs to be filled as it can be considered as VOID left in a newly constructed building. Gaps will get filled in next downleg of Nifty most probably in February.
1 Gap :4641-4676
2 Gap:4744-4772
3 Gap:4879-4905
4 Gap:4947-4991
2 another small gaps are remaining with small gap of 8 points which we can ignore for time being.
Keep watch on above levels as Gap provides an excellent trading opportunities.
Nifty Daily
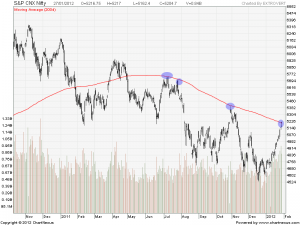
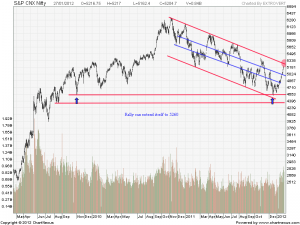
On Daily charts Nifty took resistance at 200 DMA and formed a Hanging Man Candlestick on daily charts.
The Hanging Man is a bearish reversal pattern that can also mark a top or resistance level. Forming after an advance, a Hanging Man signals that selling pressure is starting to increase. The low of the long lower shadow confirms that sellers pushed prices lower during the session. Even though the bulls regained their footing and drove prices higher by the finish, the appearance of selling pressure raises the yellow flag. Hanging Man requires bearish confirmation before action. Such confirmation can come as a gap down or long black candlestick on heavy volume.
So Monday Close in Nifty needs to be seen closely for confirmation of any reversal pattern.
Volume Climax
 Volumes with price action data analysis always provided has inclination of what are the intention of smart money going forward.Look at the Blue Circles i have marked in above charts. These days were identified as BIG VOLUME DAYS and on an average after 3-5 session Nifty has started its correction.
We had a big volume day on 25 Jan so next week will be crucial as per past historical trends.
I do not expect market to fall in straight line we will have a phase of consolidation than again a trending market,Markets will never move in a single line.
If we draw trendline resistance on Daily charts it comes at 5260 as shown in above chart.
Indicators can remain Overbought and Oversold for a extended period of times Nifty has been rallying for 5080 the area where indicators went overbought and it made a high of 5217 in this overbought state.
,Save the above chart and try to take less dependance on indicators before taking trading decision. Price has everything in it only you need to follow it closely.
Use Indicators for additional confirmation but never for trade initiation.
Nifty Fibonacci Levels
 As per Fibo levels Nifty stopped exactly at 78.6% retracement of 4532-5217. So Fibo level at work. Wait for break and close above 5217 before any trade on long side.
Nifty Weekly Chart
On Weekly charts we have trendline resistance at 5251. Weekly charts are still not overbought and Nifty weekly trend is Up. Nifty Weekly mometum will fade only on a close below 5123 till than weekly trend is Up.
Higher time frame should always be given preference for positional traders.
Nifty Monthly Chart
 Out of 685 points Nifty rally. 450 points had come on last 4 Tuesdays, i.e. 3rd, 10th, 17th and 24th Next Tuesday is on 31 Jan is also Tuesday and Monthly closing so exciting Tuesday is waiting for us. Will History repeat itself?
Monthly Trend will get into momentum on a close above 5285


Sir Nifty Points r Excellent Please Inform the Techinical Points of Bank Nifty Also
Happy Engagement!
When are you getting wed-locked?
Wish you all the very BEST!!!
Thanks a Lot Sir…
Still dates not decided.
Rgds,
Bramesh
Missed some points in last comment 😉 , I was expecting Nifty might not sustain 200EMA (5130) by considering other Indicators as they are telling Market is overbought, But RBI policies pushed Nifty above 5130. . .
Regards…..
Subbu. . .
Dear Subbu Sir,
Thanks a lot for your clear cut views.
Keep sharing your views with us.
Hi, Bramesh Bhai,
As i always say you are the best, this week analysis is also awesome.
Just want to share my view here,
Nifty 200EMA comes near 5130, in my experience Nifty sustaining above 200EMA when all the indicators giving signal as market is overbought is a very confused situation, In daily chart we can observe Nifty after crossing 200EMA both candles are bear sticks, As Bramesh mentioned huge volume was traded on 25/01/2012 and Nifty traded flat on 26/01/2012(we may consider it as Friday sentiment). Before that on 13/01/2012 also huge volume was traded and the Bulls started rally toward 200EMA(5130), but now there are chances of bears rally too, after all Indicators also matters with trendline.
Trade safely friends.
Happy trading.
Regards. . . .
Subbu.
Dear Bramesh,
You have written the fifth gap as 5114 to 5131 while the OHLC value of
24 & 25 Jan, 2012 for Nifty Spot are as under.
Date Open High Low Close
25-Jan-12 5,151.50 5,174.15 5130.25 5,158.30
24-Jan-12 5,064.80 5,141.05 5,049.80 5,127.35
So it is clear that fifth gap do not exist
Please clarify.
Thanks and regards
Yes sir ur right it got filled on 2:30 candle on subsequent day.
I have corrected the analysis. Thanks a lot for your eagle eye on levels.
Rgds,
Bramesh
Dear Bramesh,
Under ‘Volume Climex” heading you suggest us to save the chart presented by you, but we are unable to save the chart given here as this feature is not allowed.
Please let us know how to save the same?
thanks and regards
Dear Sir,
Click on Chart,It will Open in a new window and Save the chart.
Rgds,
Bramesh
hi,
Please answer my question bramesh… I am keeping an eye on selling activities of DII, they are selling in huge amounts in this 500 pts rally…. does it mean we r gonna see a big fall below 4500 or DII is fool?
It is not related to make trading decision but just a big doubt.
rgrds
suresh
Dear Sir,
Try to develop a trading system stick with system with discipline. NO one can predict Top and Bottom of market.
DII sell every rally we witnessed in market. They are business man and motive is to make money for there fund holder.
So instead of giving more important to there activities and thinking of certain levels will not help us.
We need to make sure we are on the right side of the trade by maintaing a healthy trading psychology and sticking to system with discipline.
Rgds,
Bramesh
I agree that Nifty has resistance at 200 DEMA and 78.6% FB but it cross than it may reach to 5650 i.e. 61.8% FBR 6339-4530. Last bear end has celebrated for three months rally by bull. Cautious if it cross 5250…………5400……..5650 and may correct.
Hi Sir,
If 5220 is crossed 5400 is an immediate target.
Rgds,
Bramesh