Reliance Industries
RIL declared a pretty bad set of numbers and Ambani known for there shrewd business tactics covered the bad result goof up with Buy back with a max price at 870. So When Promoters itself do not consider the current valur of company more than 870 as per current business scenario.
To add to it Buy back @870 does not mean that Stock will trade above 870 a general misconception most of people are having.
It basically means than if stock trades at 550 also Promoters will buy at 550. Maximun Upside is capped to 870.
Last time RIL declared Open Offer of 2000 Cores 2004 its bought just 529 cores from open market. Also this Open offer needs to be approved by SEBI.
Looking at Technicals of RIL 770-772 is cluster of resistance zone as shown with Trendlines in above chart.
So any upside will be above 772 only and downside below 753.
Sell below 752 TGt 748,740,732 and 716
Buy above 776 Tgt 788 and 800
SBI
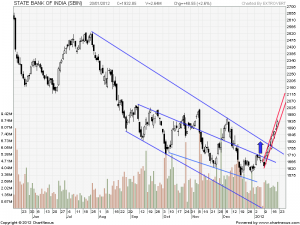
 SBI is having a dream run from low of 1580-1967. Stock has been rising before its results and CRR cut anticipation by RBI.
Looking at chart SBI is trading in a channel upside resistance at 1972. High till now is 1967 on downside 1921-24 levels.
Sell below 1920 Tgt 1904,1875
Buy above 1972 Tgt 2001 and 2040
Larsen and Tubro
 LT will be coming with its results today during market hours.
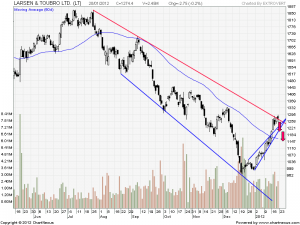
1293-1300 looks like a likely top of LT being a trendline resistance. On downside 1210 which is 4 days low will act as support.
Sell below 1210 Tgt 1177,1150 and 1124
Buy above 1274 Tgt 1293,1310 and 1328

