Wishing all Site Readers a Merry Christmas and Happy and Profitable New Year 2012
It’s Christmas Eve today and we are almost reaching the close of 2011. From India’s perceptive 2011 is the year everyone wants to forget as it was primarily characterized by prolonged bear market, economic slump,inflation,corruption scams and weak rupee.
Will things change in 2012 for India and World’s Perceptive?
In India a State Level election poll will keep the governments busy in wooing people to vote for them and expect policy log jam at center for the time being. From Stock Market perceptive Inflation is showing moderation Food Inflation at 3 Years Low, but 13 rate hikes have put the brakes on economic growth. It will take a while before the growth engine starts chugging along at full steam. Stock Markets takes the cues in advance and price in both good and bad news well in advance.
THERE IS ALWAYS DARKNESS BEFORE THE DAWN and we all expect a brighter 2012 which will make us forget the doom and gloom of 2011
Lets jump into the technical of Nifty for last trading week of 2011. On Personal front i expect it to close on a Strong note looking at History of December month on account of Increasing fund flow for US markets,value buying by Indian Mutual funds and Quarter ending so NAV adjustment by MF and Hedge funds.
As per Last Week Analysis (Click on Link) we anticipated a relief rally above 4675 and Nifty made a high of 4762 above 4675.
Nifty Hourly
Nifty on Hourly chart was able to close above the hourly trendline support of 4700 which is bullish in extremely short term. Nifty if able to protect 4660 on downside we can expect a bullish expiry next week. I do not expect the break of 4531 as per data analysis and chart formation.Click on below link to read more about the analysis
Has Nifty made bottom in December Series
Nifty Daily
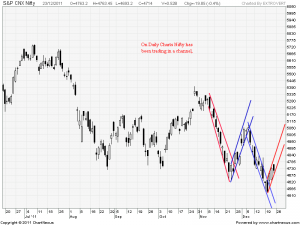
 On Daily chart Nifty took support at much anticipated levels of 4531 as shown in above chart and we saw the much awaited pullback. Next level of resistance comes at 4840 which was the breakdown level towards the low of 4531.Till Higher Highs formation on daily charts is not broken the pullback can extend to expiry week.
Volumes of the pullback are on lower end which has been the characteristics of previous pullback. Volumes of NF last Friday were lowest in the December series.
A peculiar characteristic of 2011 bear market is Nifty making wild moves but it trades within a channel and identifying the correct channel is Key to success in NF trading.
Nifty Fibonacci Level
 Fibo levels from high of 5100 to low f 4531 50% is at 4813 and all important 61.8% retracement at 4880. Next week we can see extention of rally till 4880 which is 61.8% retracement and trendline resistance also.
Nifty Weekly
 On Weekly chart Nifty was up just 1.3% after a waterfall decline of 7.3% is past 2 weeks.If you see Weekly charts closely week after which Nifty makes a panic low Nifty is up in the range of 2-7% in immediate next week.
For Eg. Nifty made a panic low of 4720 26/8 and Week after that Niftyw as up 6.2%
So which give us one more evidence of Nifty can try to make a pullback in coming Week and end 2011 of a strong note.
Nifty Monthly
 On Monthly chart Nifty is down 2.4% but still trading below the broken multimonth trendline. We have 5 days before the end of 2011 and close above 4840 will make Nifty comes back into the trendline channel
RSI and Stoch are oversold on Monthly charts.
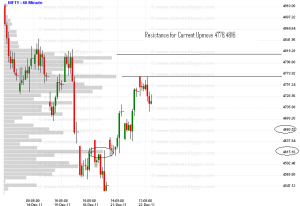
Nifty Future Volume Profile
As per volume profile Resistance is at 4778 and 4816 NF Support at 4660 and 4615.
S&P 500 US Market
 The most Widely tracked market in the World S&P 500 has atlast broken its 200 DMA which is highly bullish. Also it broke trendline which is bullish signal. S&P is jsut 40 points aways from its August high of 1307 .
Aug was the month when S&P has downgraded the US Market so closing above this 1307 will make the effect of rating downgrade nullified.
Trading Levels for expiry Week
Nifty Trend Deciding Level:4762
Nifty Resistance:4806,4880,4910
Nifty Support:4660,4613,4575 and 4531


Pls let me know if you provide tutorial on FII data analysis.. it would help me in my technical analysis further.
regards
chaitanya
Hello Bramesh,
Please let me know how/where can we get hourly chart data from?
Dear sir,
Is there any significance on crossover of 50/200 ema on daily charts…
Pls explain.
Thanks
Rohit
Dear Rohit,
I do not track the crossover of 50/200 so will not be able to comment.
You can backtest the same and find out yourself does it prove to a good and profitable strategy on crossover of 50/200
Rgds,
Bramesh