Human emotion is both the source of opportunity in trading and the greatest challenge.
Master it and you will succeed.
Ignore it at your peril.
Nifty Hourly
 Lets start from Hourly charts One Big Red Candle did the Whole Damage.. From Morning Nifty kept on trading between 4830-4875. Than came the free fall which led to panic selling as soon as low of 4756 got taken out.
I feel we are forming a base around 4700 levels as its the 3 time Nifty has bounced from the level of 4700, On the contrary it makes a case for bears also as Support has been tested for 3 times and next time if selling comes its bound to break down.
I will go with Double Bottom scenario(Bullish Pattern) where Nifty made a slightly higher bottom of 4728 with oversold indicators in Hourly time frame.
Resistance being 4822,4846 and 4870
Nifty Daily
I have discussed the probability of Trading between 4800-4700 zone as there have been sharp bounces in this range but no trading happening in my Weekly Technical Analysis.
This week we have spent 2 days trading this range.My preferred scenario is again the Ranged trading Buying at Bottom of range ie.4720-30 and selling at Top end ie.4870
Previous Support will become Resistance ie. 4796,4820,4846 and 4870
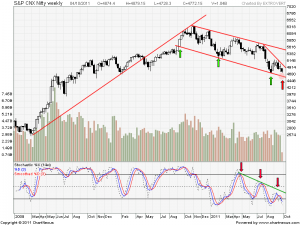
Nifty Weekly
 Weekly Stochastic has reached oversold zone and a bounce back will be commence either today or Friday. Today we need a close above 4806.
Tomorrow will be a Holiday on eve of Dusherra and Today very Important Data ADP employment Report will come in US so if we open soft during opening by closing we can end up in green propelled by short covering as traders will not prefer to carry shorts before such an important event.
Levels to Trade
Buy above 4806 Tgt 4822,4846 and 4870
Sell below 4720 Tgt 4675,4648 and 4610
Charting Software : http://www.brameshtechanalysis.com/charts/charting-software/
Follow on Facebook during Market Hours: http://www.facebook.com/pages/Brameshs-Tech/140117182685863
Want to Learn How to Trade using a Proper System Profitably Call@09985711341

