VIX Denotes the fear in the market ,fear of downfall. Nifty cracked from past 5 trading sessions after reaching a tad below it life time high.
 VIX is updated on EOD Basis @http://livevixchart.blogspot.com/
I have attached the Daily Charts of VIX chart.
As seen from the chart VIX is touching the upper trendline of channel 2@23.86 Levels and at lower level forming higher lows around 19. If VIX breaks 23.86 tommrow we are in for a more correction and if we are able to resist this channel and move towards to lower end of channel around 19 we are in for a rise on NIfty.
Looking at Technical Indicator RSI is forming negative divergence and Stoc is on overbought levels and also showing negative divergence forcing my views to be bearish on VIX and Bullish on Nifty.
NIFTY DAILY CHARTS
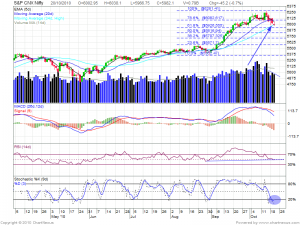
Nifty after touching a new 2010 high of 6284 dropped down heavily in last 5 trading sessions correcting almost 300 points giving much awaited correction and turning most of people on street to be on bear side .Looking at the daily chart above we can see Nifty taking support at 34 SMA High which is at 5962 levels and bouncing around those levels.
IF one take Fibo Levels from the low of 5352 to High of 6284 our 61.8% Retracement comes at 5942 levels where we have good support for short term.
Looking at technical Indicators
Stoch which is considered as Leading Indicator is showing Oversold levels and indicating we can see a good bounce in coming sessions to 6050,6100 levels.
RSI is showing positive divergence fueling to our bullish views.
Nifty if it is able to close above 6100 for 1-2 sessions can again put balls in BUll court and we can make a new high in October series only.
Nifty Resistance @6057 and 6097
Nifty Support@ 5953,5942 and 5924 levels
Bank Nifty
Bank Nifty is forming a parallel channel with Support at 12111 and resistance at 12519.
STOCH oversold and bounce back to upper range is possible in coming few trading sessions


