


Analysis of FIIs’ behavior in the Nifty Index Futures market shows a Bearish approach as they displayed a preference for SHORT positions. On a net basis, FIIs went SHORT 17578 contracts worth 1708 crores, resulting in an decrease of 68604 contracts in the Net Open Interest.
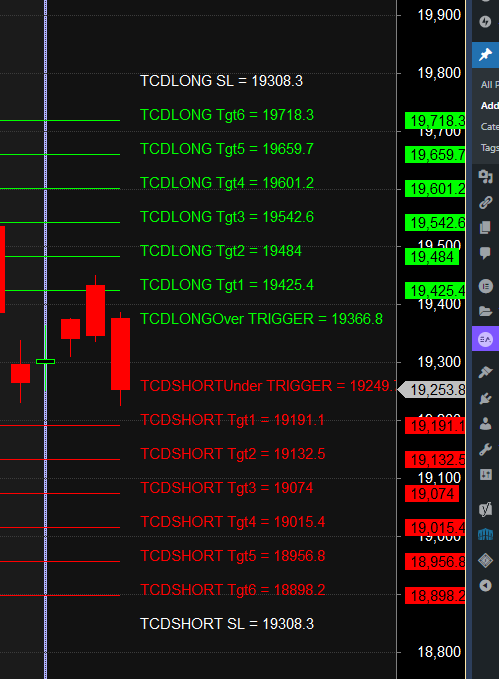
Nifty Trade Plan Bulls will get active above 19366 for a move towards 19425/19484/19542. Bears will get active below 19250 for a move towards 19191/19132/19074
Traders may watch out for potential intraday reversals at 10:27,11:15,12:22,1:22,2:07 How to Find and Trade Intraday Reversal Times
Nifty Sep Futures Open Interest Volume stood at 1 lakh cr , witnessing a addition of 26 lakh contracts. Additionally, the increase in Cost of Carry implies that there was a addition of SHORT positions today.
Nifty Advance Decline Ratio at 25:25 and Nifty Rollover Cost is @19445 and Rollover is at 74.1 %.
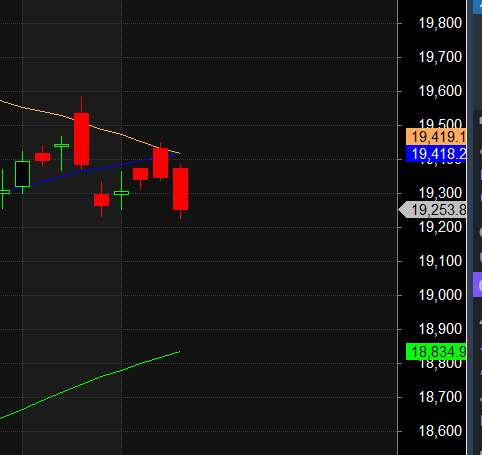
Nifty has finally close below 50 SMA with a gap down now 19375-19400 is zone of resistance , Any break of 19234 fast fall towards 18888
Nifty options chain shows that the maximum pain point is at 19300 and the put-call ratio (PCR) is at 0.85 . Typically, when the PCR open interest ranges between 0.90 and 1.05, the market tends to remain range-bound.
Nifty 50 Options Chain Analysis
The Nifty 50 options chain indicates that the highest open interest (OI) on the call side is at the 19400 strike, followed by 19500 strikes. On the put side, the highest OI is at the 19200 strike, followed by 19100 strikes. This suggests that the market participants are expecting Nifty 50 to remain range between 19200-19400 levels.
In the cash segment, Foreign Institutional Investors (FII) sold 2973 crores, while Domestic Institutional Investors (DII) bought 4382 crores.
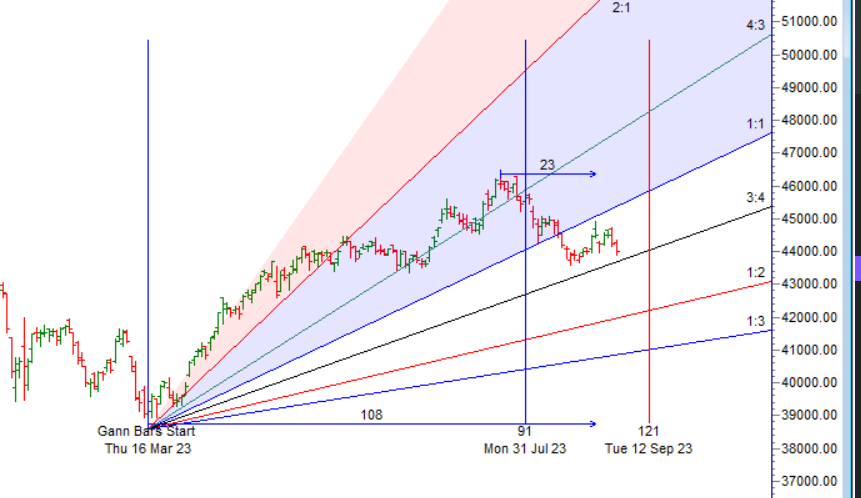
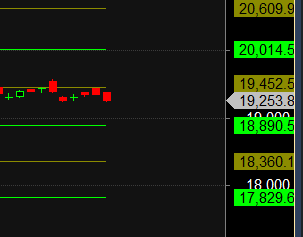
Traders who follow the musical octave trading path may find valuable insights in predicting Nifty’s movements. According to this path, Nifty may follow a path of 18890-19452-20014 This means that traders can take a position and potentially ride the move as Nifty moves through these levels.Of course, it’s important to keep in mind that trading is inherently risky and market movements can be unpredictable.Price has closed below 19452 7 days in a row
Our sense of self is enhanced by size, be it in trading large numbers, living in a big house, driving a big car, or owning a big boat. Our egos swell in proportion to the bigness of our risk assumption.
For Positional Traders, The Nifty Futures’ Trend Change Level is At 19408 . Going Long Or Short Above Or Below This Level Can Help Them Stay On The Same Side As Institutions, With A Higher Risk-reward Ratio. Intraday Traders Can Keep An Eye On 19492 , Which Acts As An Intraday Trend Change Level.
Intraday Trading Levels
Buy Above 19335 Tgt 19370, 19400 and 19444 (Nifty Spot Levels)
Sell Below 19250 Tgt 19225, 19200 and 19170 (Nifty Spot Levels)
Wishing you good health and trading success as always.As always, prioritize your health and trade with caution.
As always, it’s essential to closely monitor market movements and make informed decisions based on a well-thought-out trading plan and risk management strategy. Market conditions can change rapidly, and it’s crucial to be adaptable and cautious in your approach.