


Analysis of FIIs’ behavior in the Nifty Index Futures market shows a Bullish approach as they displayed a preference for LONG positions. On a net basis, FIIs went LONG 2358 contracts worth 227 crores, resulting in an increase of 5590 contracts in the Net Open Interest. Additionally, they bought 8773 long contracts and added 10034 short contracts, indicating a strategy of adding long positions and of adding short positions. Till Date FII’s are added 1617 Long and added 538 SHORT and Retailers are long 15244 contracts and covered 40241 contracts.
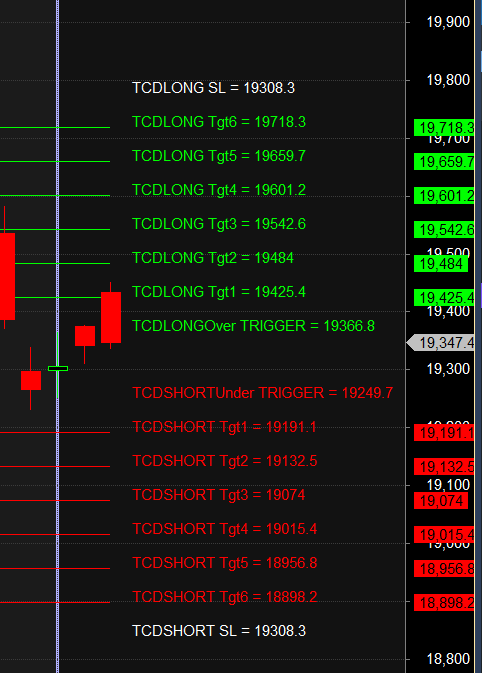
Nifty Trade Plan Bulls will get active above 19366 for a move towards 19425/19484/19542. Bears will get active below 19250 for a move towards 19191/19132/19074
Traders may watch out for potential intraday reversals at 10:31,11:19,12:28,1:52,2:10,2:55 How to Find and Trade Intraday Reversal Times
Nifty Sep Futures Open Interest Volume stood at 0.74 lakh, witnessing a addition of 16.6 lakh contracts. Additionally, the increase in Cost of Carry implies that there was a covering of SHORT positions today.
Nifty Advance Decline Ratio at 25:25 and Nifty Rollover Cost is @19860 and Rollover is at 73.9 %.
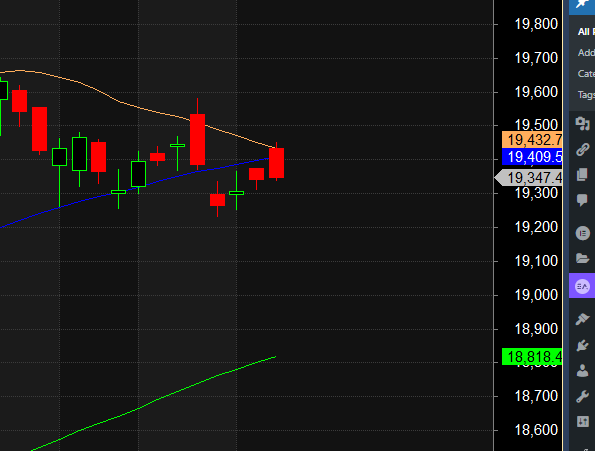
Nifty has finally close below 50 SMA with a gap down now 19375-19400 is zone of resistance , Any break of 19234 fast fall towards 18888
Nifty options chain shows that the maximum pain point is at 19400 and the put-call ratio (PCR) is at 0.85 . Typically, when the PCR open interest ranges between 0.90 and 1.05, the market tends to remain range-bound.
Nifty 50 Options Chain Analysis
The Nifty 50 options chain indicates that the highest open interest (OI) on the call side is at the 19400 strike, followed by 19500 strikes. On the put side, the highest OI is at the 19200 strike, followed by 19100 strikes. This suggests that the market participants are expecting Nifty 50 to remain range between 19250-19400 levels.
In the cash segment, Foreign Institutional Investors (FII) bought 494 crores, while Domestic Institutional Investors (DII) bought 1323 crores.
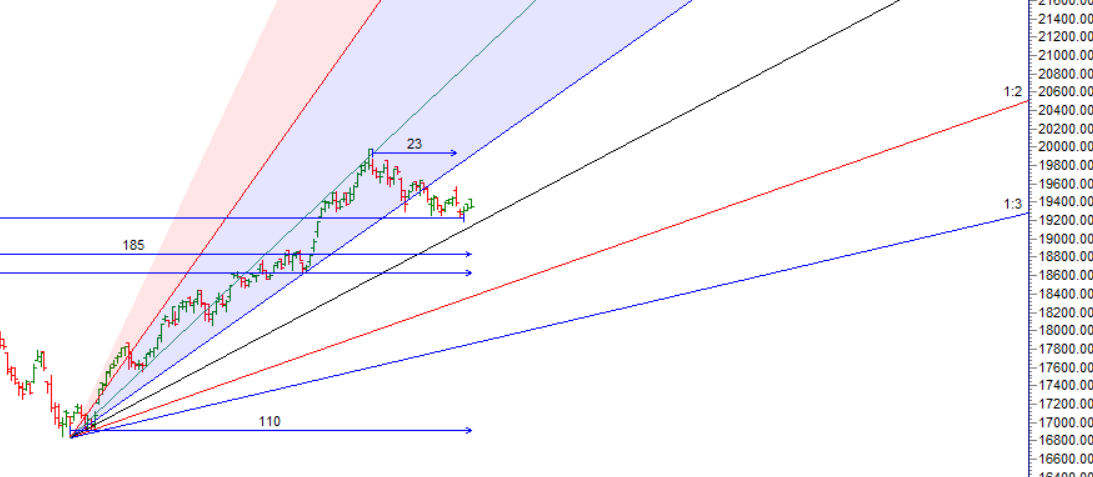
Traders who follow the musical octave trading path may find valuable insights in predicting Nifty’s movements. According to this path, Nifty may follow a path of 18890-19452-20014 This means that traders can take a position and potentially ride the move as Nifty moves through these levels.Of course, it’s important to keep in mind that trading is inherently risky and market movements can be unpredictable.Price has closed below 19452 7 days in a row

We must realize that the market defies logic. It has a logic all its own, and it won’t tell us in advance what its reaction to events will be. We can watch for clues and then react.
For Positional Traders, The Nifty Futures’ Trend Change Level is At 19517 . Going Long Or Short Above Or Below This Level Can Help Them Stay On The Same Side As Institutions, With A Higher Risk-reward Ratio. Intraday Traders Can Keep An Eye On 19403, Which Acts As An Intraday Trend Change Level.
Intraday Trading Levels
Buy Above 19400 Tgt 19444, 19484 and 19512 (Nifty Spot Levels)
Sell Below 19350 Tgt 19312, 19274 and 19230 (Nifty Spot Levels)
Upper End of Expiry : 19466
Lower End of Expiry : 19227
Wishing you good health and trading success as always.As always, prioritize your health and trade with caution.
As always, it’s essential to closely monitor market movements and make informed decisions based on a well-thought-out trading plan and risk management strategy. Market conditions can change rapidly, and it’s crucial to be adaptable and cautious in your approach.