


The Indian general elections are a major event, not just politically but also economically. Given the country’s diverse and dynamic democracy, these elections have significant implications for market participants. One of the most telling indicators of market sentiment during such high-stakes periods is the VIX (Volatility Index), often referred to as the “fear gauge.” This article delves into the historical behavior of the VIX during Indian general elections, analyzing its trends, causes, and implications for investors.
Understanding the VIX
Before diving into historical insights, it’s essential to understand what the VIX represents. The VIX is a real-time market index representing the market’s expectations for volatility over the coming 30 days. It is derived from the prices of options on the Nifty 50 index, which is a benchmark of the Indian stock market. A high VIX indicates higher expected volatility, which usually corresponds to greater uncertainty or fear in the market.
The Indian General Elections: A Period of Volatility
Indian general elections, held every five years, are a time of heightened political activity and uncertainty. With over a billion people, numerous political parties, and regional as well as national issues at play, predicting the outcome is often complex. This uncertainty typically spills over into the financial markets, influencing investor behavior and market volatility.
Historical Analysis of VIX During Elections
2004 General Elections
The 2004 Indian general elections were marked by the unexpected victory of the Indian National Congress (INC) over the Bharatiya Janata Party (BJP). Leading up to the elections, the market had priced in a continuation of the BJP-led government. The VIX during this period showed a marked increase in volatility.
Pre-Election Period: In the months leading to the elections, the VIX was relatively stable, hovering around the 20-25 range, reflecting moderate market uncertainty.
Election Results Announcement: The results, announced in May 2004, led to a significant spike in the VIX, reaching highs of around 35. This spike was due to the surprise victory of the INC and concerns about potential policy changes.
Post-Election Period: In the weeks following the elections, as the new government settled in and policy directions became clearer, the VIX gradually declined back to its pre-election levels, indicating a reduction in market anxiety.
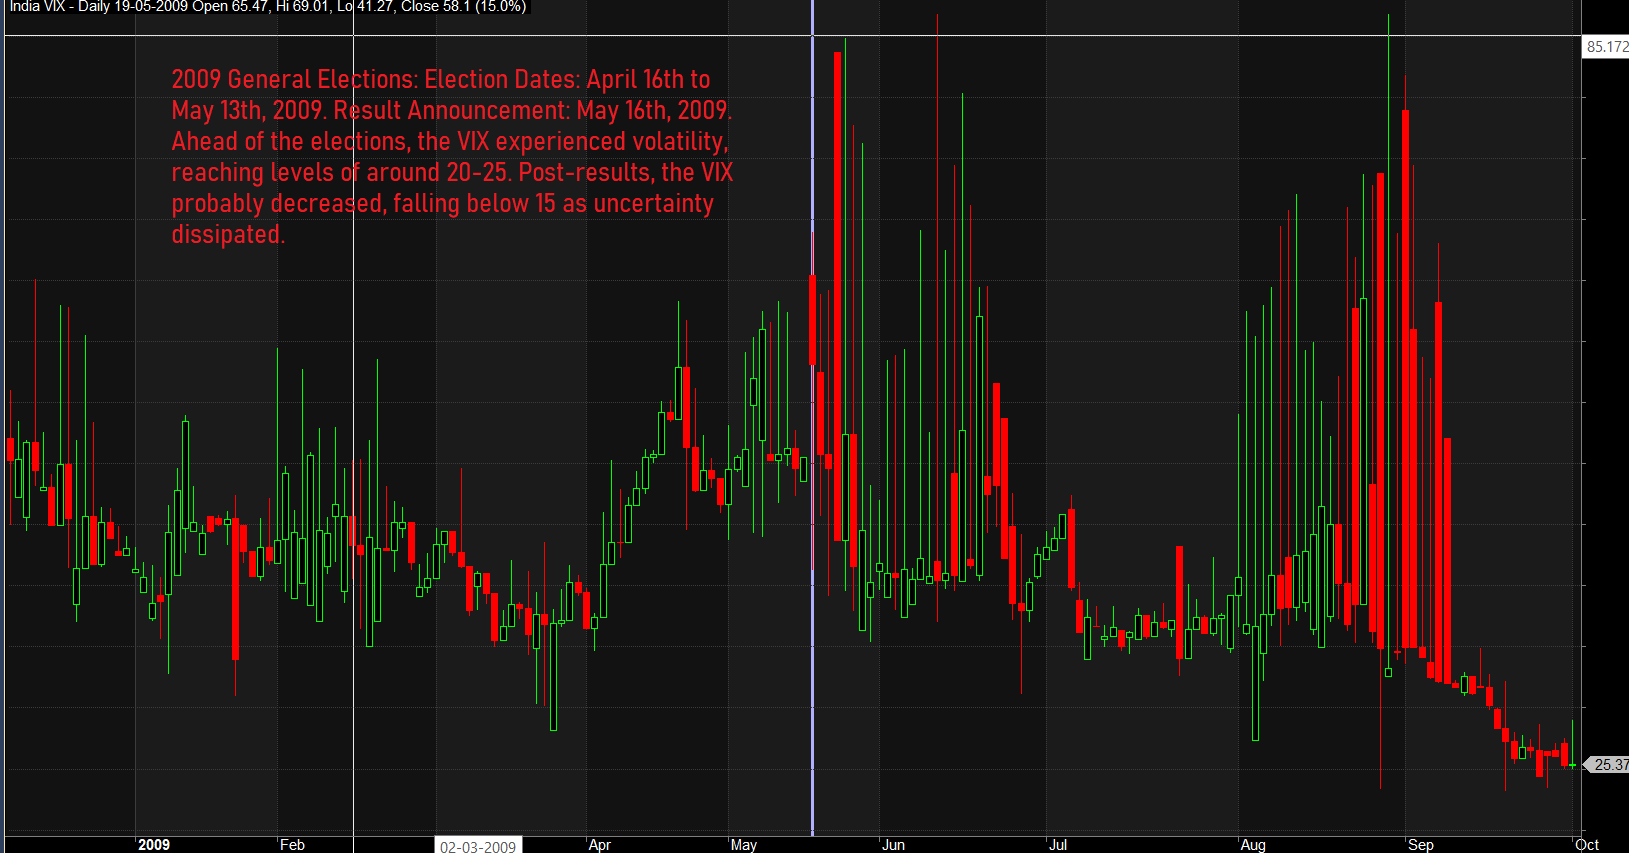
2009 General Elections
The 2009 elections saw the INC retaining power with a larger majority, which was seen as a positive outcome by the markets, ensuring stability and continuity in economic policies.
Pre-Election Period: The VIX in early 2009 was already elevated due to the global financial crisis, ranging between 30 and 40.
Election Results Announcement: The announcement of the INC’s victory in May 2009 led to a sharp decline in the VIX, dropping to around 25. The market viewed the results positively, expecting policy continuity and stability.
Post-Election Period: The VIX continued to decrease post-elections, reaching levels below 20 as the global financial environment also began to stabilize.
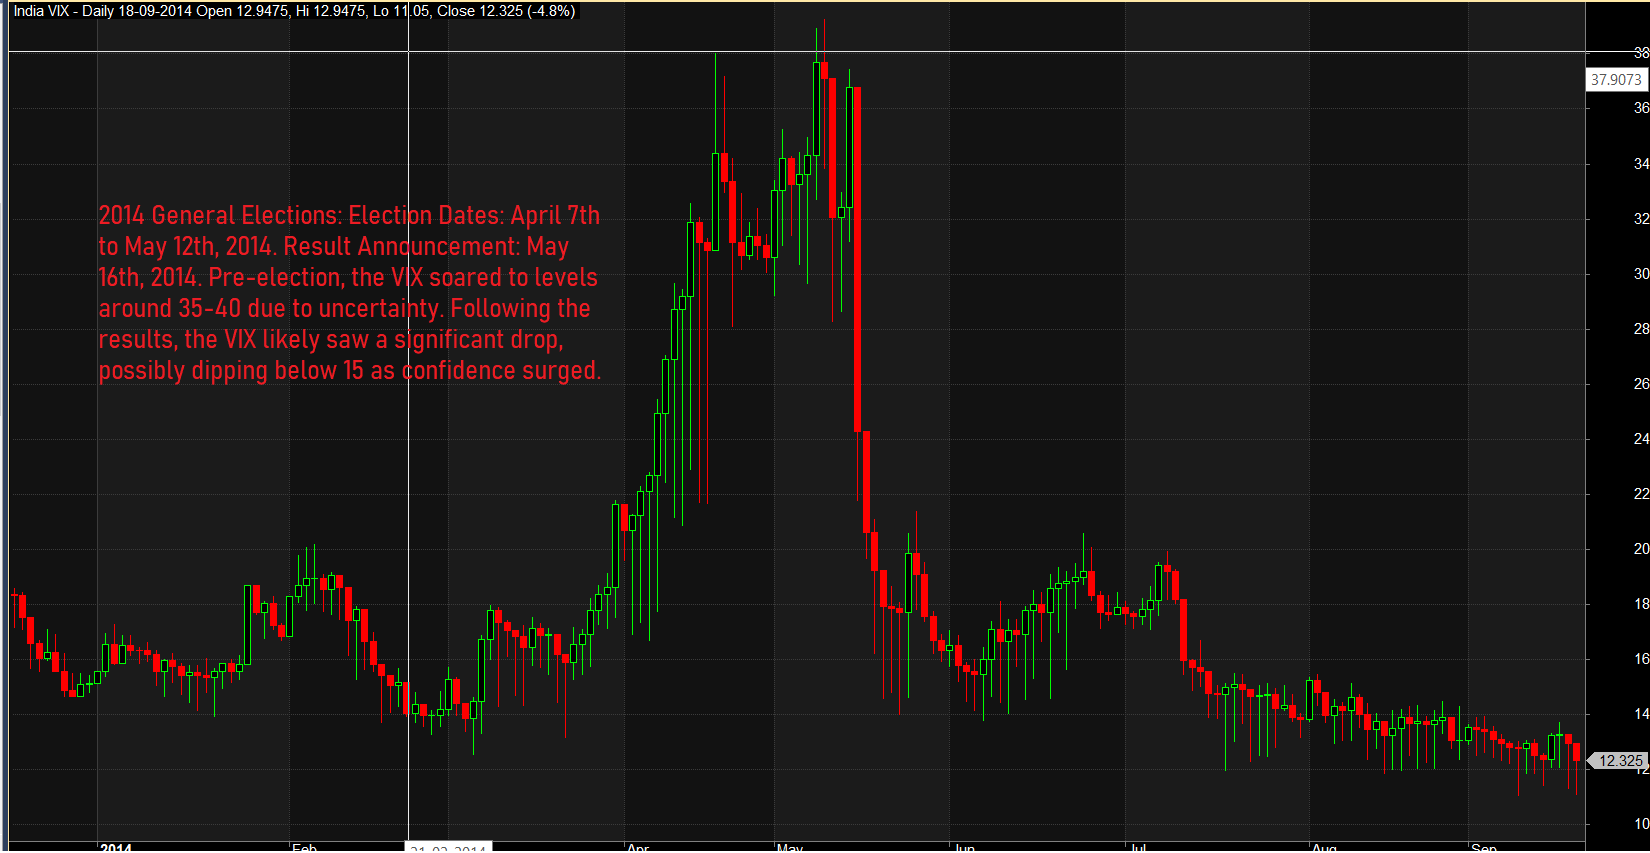
2014 General Elections
The 2014 general elections were notable for the overwhelming victory of the BJP led by Narendra Modi. The market anticipated this result, leading to a unique VIX pattern.
Pre-Election Period: Leading up to the elections, the VIX saw a gradual increase, reflecting rising uncertainty and speculative activity. By April 2014, the VIX was around 25.
Election Results Announcement: Upon the BJP’s victory in May 2014, the VIX initially spiked to around 30, indicating a knee-jerk reaction to the official announcement. However, it quickly dropped as market confidence grew in the new government’s pro-business stance.
Post-Election Period: The VIX fell sharply post-elections, reaching lows around 15, as investors became optimistic about the economic reforms promised by the new administration.
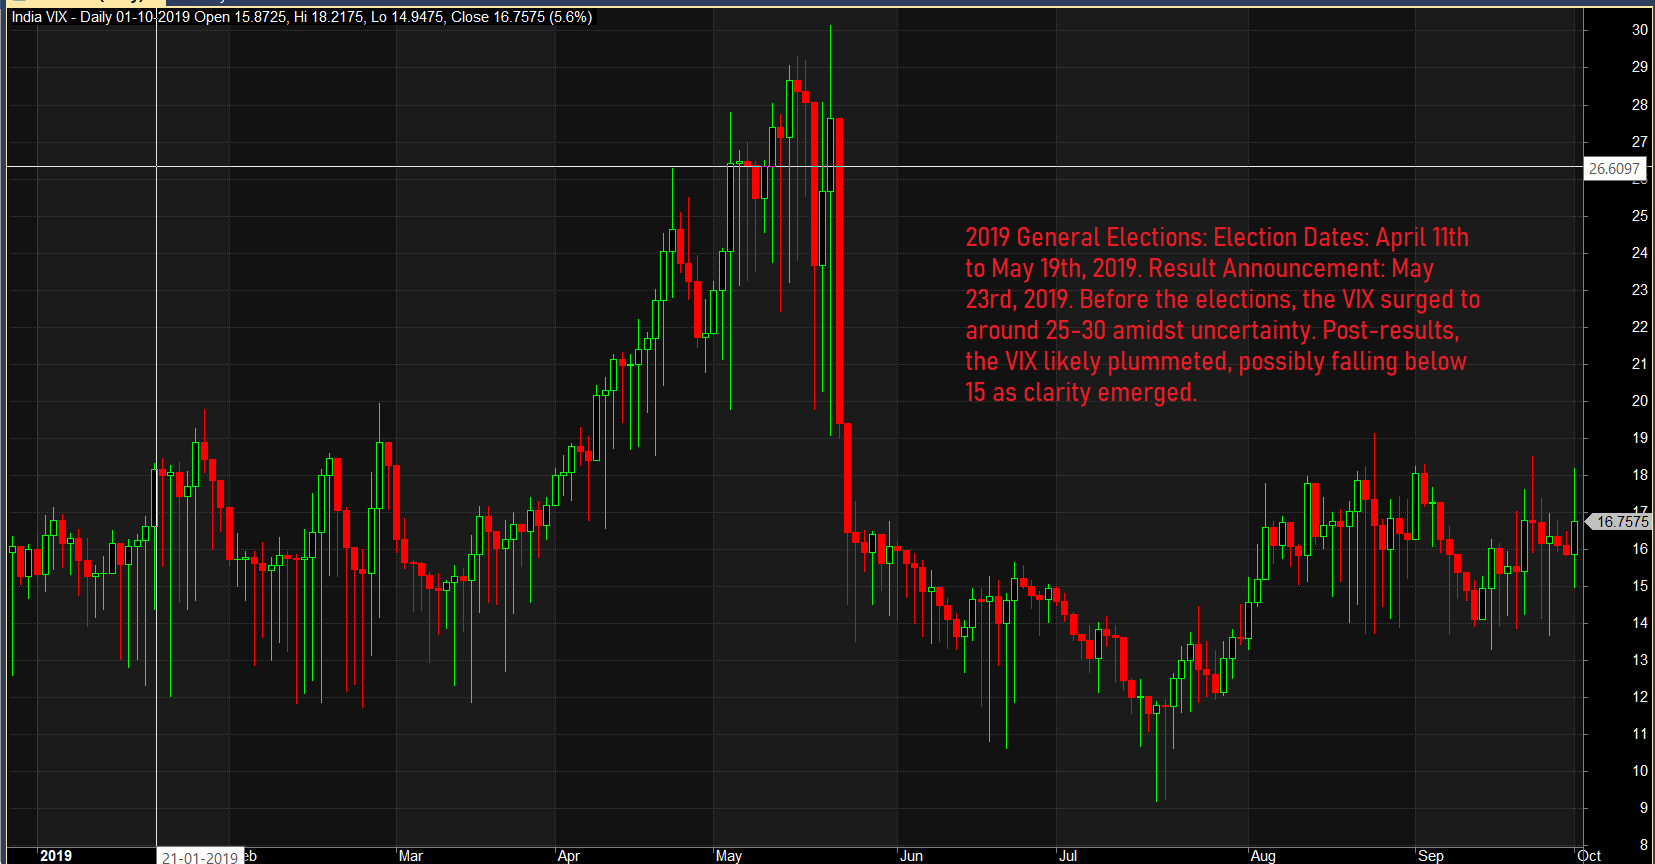
2019 General Elections
The 2019 elections saw the BJP securing another term with an even larger mandate. This period provides a fascinating insight into market behavior during times of perceived stability versus times of change.
Pre-Election Period: In the months leading up to the 2019 elections, the VIX was relatively stable, around 15-20, suggesting moderate market anxiety.
Election Results Announcement: The announcement of the BJP’s victory led to a temporary spike in the VIX to about 25, driven by short-term speculative activity.
Post-Election Period: The VIX quickly normalized, dropping back to around 15, reflecting investor confidence in the continuity of economic policies and reforms.
Factors Influencing VIX Behavior During Elections
Several factors contribute to the behavior of the VIX during Indian general elections:
Market Sentiment and Expectations
Market participants often form expectations based on pre-election surveys, political campaigns, and media reports. When the actual election results deviate from these expectations, it leads to significant market volatility, as observed in the 2004 and 2014 elections.
Economic Policies and Reforms
The market’s perception of the potential impact of new or continuing economic policies plays a crucial role. Pro-business and reform-oriented policies typically lead to reduced volatility, as seen in 2014 and 2019, whereas uncertainty regarding policy directions can spike the VIX, as in 2004.
Global Economic Environment
The global economic context cannot be ignored. For instance, the elevated VIX during the 2009 elections was partly due to the ongoing global financial crisis. Conversely, periods of global economic stability tend to moderate VIX spikes during elections.
Speculative Trading
Elections are fertile ground for speculative trading, with traders betting on various outcomes. This speculative activity often results in short-term spikes in the VIX, which normalize once the results are clear and the market digests the outcome.
Implications for Traders
Understanding the historical behavior of the VIX during Indian general elections provides valuable insights for traders. Here are some key takeaways:
Risk Management
Traders can use the VIX as a tool for risk management. By monitoring the VIX, they can gauge market sentiment and adjust their portfolios accordingly, either by hedging their positions or by reducing exposure to equities during periods of high volatility. Also by Selling DEEP OTM Options.
Opportunity for Gains
Periods of high volatility, indicated by a rising VIX, often present opportunities for savvy traders. These periods can lead to mispriced assets, allowing for strategic buying at lower prices or selling at higher prices.
Long-Term Perspective
Despite the short-term volatility associated with elections, the long-term trend of the Indian stock market has been upward. Investors with a long-term perspective might use periods of heightened volatility as entry points, capitalizing on temporary market disruptions.
Diversification
During election periods, diversifying investments across asset classes and geographies can mitigate risks associated with domestic political uncertainty. This strategy helps cushion the impact of volatility on the overall portfolio.
Conclusion
The VIX serves as a crucial indicator of market sentiment during Indian general elections, reflecting the underlying anxiety and uncertainty. Historical trends reveal that while elections lead to short-term spikes in the VIX, the market tends to stabilize once the results are clear and policies are understood. For investors, understanding these patterns is vital for effective risk management and capitalizing on opportunities during these tumultuous periods. By staying informed and strategically navigating the volatility, investors can turn the challenges of election periods into profitable ventures.