


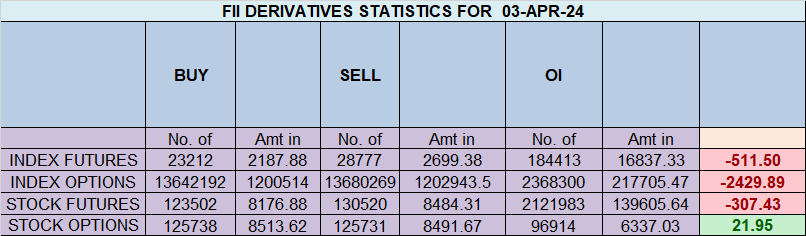
Foreign Institutional Investors (FII) showed a Bearish approach in the Index Futures market by SELLING 5565 contracts worth 511 crores, resulting in an increase of 10349 contracts in the Net Open Interest. FIIs bought 2392 long contracts and added 7957 short contracts, indicating a preference for SHORTING new positions. With a Net FII Long Short ratio of 0.13 , FIIs used the market rise to enter long and enter short positions in Index Futures
As Discussed in Last Analysis The Indian stock market has been on a rollercoaster ride in recent times, with the benchmark Nifty 50 index experiencing wild swings in both directions. However, a recent development has caught the attention of many traders and investors: the formation of a DOJI candlestick pattern on Nifty’s monthly timeframe. For those unfamiliar with candlestick charting, a DOJI candlestick occurs when the opening and closing prices of an asset are very close to each other, resulting in a very short body and long wicks. This pattern is often considered a sign of indecision in the market, as buyers and sellers are equally matched.DOJI pattern alone is not enough to predict a price reversal, and that it must be confirmed by Gann and Astro Analysis
As a trader, it is essential to be well-informed and prepared before the RBI policy announcement. With Nifty being one of the most popular indices for trading, it is crucial to have a sound trading strategy to take advantage of the market volatility.
Nifty closed above 4×3 Gann Angle as shown in below chart which is a Bullish sign and now price need to Hold 17326 for bullishnes to continue.

If you’re looking to enhance your trading potential, consider incorporating the Nifty 200 DMA and 50% retracement into your analysis and see how they can help you identify potential trading opportunities in the stock market. The Nifty 200 DMA, or 200-day moving average, is a commonly used technical indicator that represents the average price of a security over the past 200 days. Traders often use this indicator to determine the overall trend of a stock or index.The 50% retracement is another popular technical indicator that is used to identify potential entry and exit points for trades. This indicator is based on the idea that after a significant price move in one direction, the price will often retrace approximately 50% of that move before resuming its trend.
17490 is an important price level to watch before the RBI Policy as it is close to both the 200 DMA and 50% retracement levels of 18134 and 16828. Today, we have Bayer Rule 2 in effect, which suggests that the trend may go down within 3 days when the speed difference between Mars and Mercury is 59 minutes, indicating a potential big move. Furthermore, with a full moon tomorrow, multiple time cycles aligning could result in a significant move in the Nifty.

Swing traders can expect a potential move towards 17467, 17532, 17598 if the market trades above 17401. However, if the market falls below 17335 , bears may become more active, leading to a move towards 17270,17204
Traders may watch out for potential intraday reversals at 9:32,12:24,1:39,2:44 How to Find and Trade Intraday Reversal Times
Nifty rollover cost is at 17120 and rollover is at 64%
Nifty April Futures Open Interest Volume stood at 1.08 lakh, witnessing a liquidation of 5.9 lakh contracts. Additionally, the decrease in Cost of Carry implies that there was a closure of longs positions today.
Nifty options chain shows that the maximum pain point is at 17400 and the put-call ratio (PCR) is at 0.92 . Typically, when the PCR open interest ranges between 0.90 and 1.05, the market tends to remain range-bound. This suggests that Nifty may trade within a range of 17300-17500 levels in the near term
According To Yesterday Data, Retailers Have Bought 332071 Call Option Contracts And 352151 Call Option Contracts Were Shorted by them. Additionally, They Bought 104698 Put Option Contracts And Added 204569 Shorted Put Option Contracts, Indicating A NEUTRAL Outlook.
In Contrast, Foreign Institutional Investors (FIIs) Bought 43926 Call Option Contracts And 22233 Call Option Contracts Were Shorted by them. On The Put Side, FIIs Bought 43668 Put Option Contracts And Shorted 9112 Put Option Contracts, Suggesting They Have Turned To A Neutral Bias.
Nifty 50 Options Chain Analysis
The Nifty 50 options chain indicates that the highest open interest (OI) on the call side is at the 17,500 strike, followed by 17,600 strikes. On the put side, the highest OI is at the 17300 strike, followed by 17100 strikes. This suggests that the market participants are expecting Nifty 50 to remain range between 17200-17500 levels.
In the cash segment, Foreign Institutional Investors (FII) bought 321 crores, while Domestic Institutional Investors (DII) sold 328 crores.
Traders who follow the musical octave trading path may find valuable insights in predicting Nifty’s movements. According to this path, Nifty may follow a path of 16825-17326-17826. This means that traders can take a position and potentially ride the move as Nifty moves through these levels.
Of course, it’s important to keep in mind that trading is inherently risky and market movements can be unpredictable. Low made was 16828 now heading towards 17826 till closing above 17326

After a Trading Loss Whatever the cause, the best solution is just to move on to the next trade with a clear mind and in good spirits.
For Positional Traders, The Nifty Futures’ Trend Change Level is At 17317 . Going Long Or Short Above Or Below This Level Can Help Them Stay On The Same Side As Institutions, With A Higher Risk-reward Ratio. Intraday Traders Can Keep An Eye On 17436 , Which Acts As An Intraday Trend Change Level.