


Foreign Institutional Investors (FII) showed a bullish approach in the Index Futures market by buying 3,639 contracts worth 267 crores, resulting in an increase of 4,341 contracts in the Net Open Interest. FIIs bought 3,990 long contracts and added 351 short contracts, indicating a preference for buying new positions. With a Net FII Long Short ratio of 0.12, FIIs used the market rise to enter long and short positions in Index Futures
The Indian stock market has been on a rollercoaster ride in recent times, with the benchmark Nifty 50 index experiencing wild swings in both directions. However, a recent development has caught the attention of many traders and investors: the formation of a DOJI candlestick pattern on Nifty’s monthly timeframe. For those unfamiliar with candlestick charting, a DOJI candlestick occurs when the opening and closing prices of an asset are very close to each other, resulting in a very short body and long wicks. This pattern is often considered a sign of indecision in the market, as buyers and sellers are equally matched.
DOJI pattern alone is not enough to predict a price reversal, and that it must be confirmed by Gann and Astro Analysis
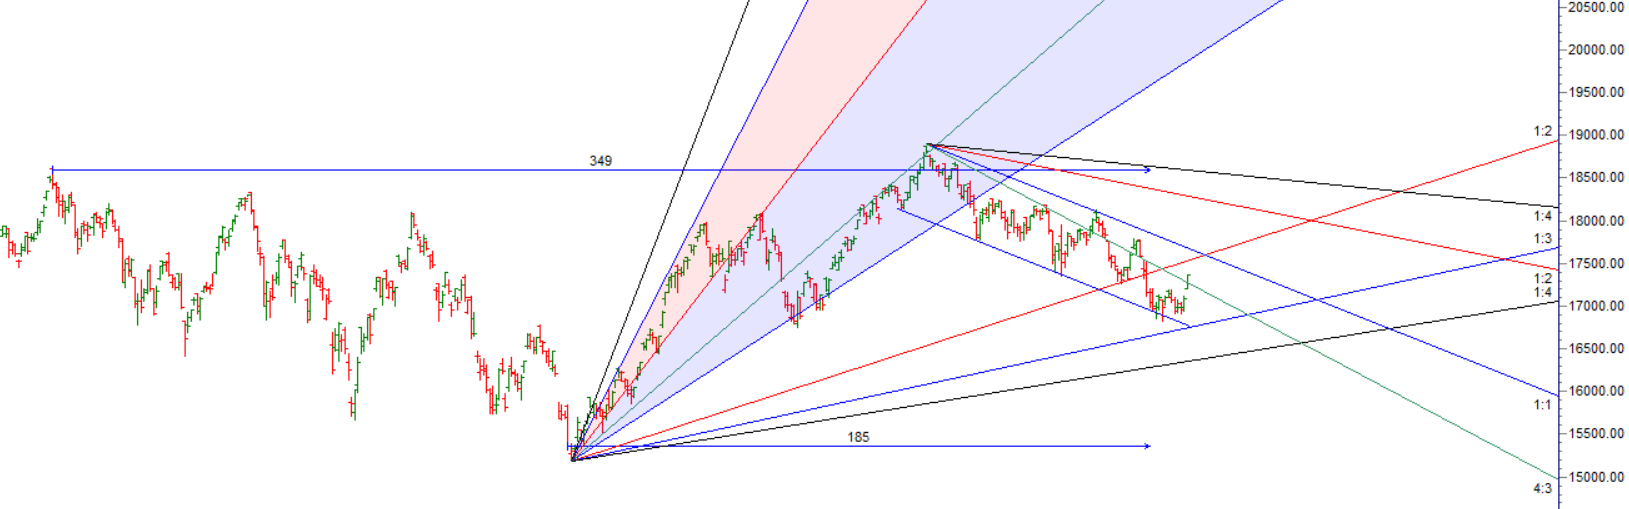
As seen in above Gann Angle Chart Price has crossed 4×3 gann angle which is a Bullish sign and now price need to hold 17225 for bullishnes to continue.
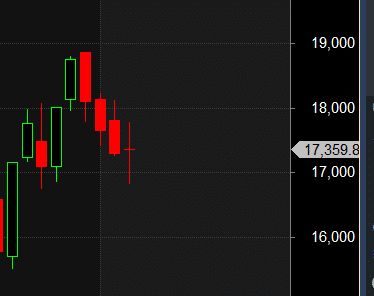
Swing traders can expect a potential move towards 17467, 17532, 17598 if the market trades above 17401. However, if the market falls below 17335 , bears may become more active, leading to a move towards 17270,17204
Traders may watch out for potential intraday reversals at 9:36,10:20,11:31,1:30,2:53 How to Find and Trade Intraday Reversal Times
Nifty rollover cost is at 17120 and rollover is at 64%
Nifty April Futures Open Interest Volume stood at 1.14 lakh, witnessing a addition of 26 lakh contracts. Additionally, the increase in Cost of Carry implies that there was a closeure of short positions today.
Nifty options chain shows that the maximum pain point is at 17350 and the put-call ratio (PCR) is at 0.89 . Typically, when the PCR open interest ranges between 0.90 and 1.05, the market tends to remain range-bound. This suggests that Nifty may trade within a range of 17300-17500 levels in the near term
According To Yesterday Data, Retailers Have Bought 808338 Call Option Contracts And 762826 Call Option Contracts Were Shorted by them. Additionally, They Bought 1606461 Put Option Contracts And Added 1351158 Shorted Put Option Contracts, Indicating A Bearish Outlook.
In Contrast, Foreign Institutional Investors (FIIs) Bought 77552 Call Option Contracts And 147769 Call Option Contracts Were Shorted by them. On The Put Side, FIIs Bought 179837 Put Option Contracts And Shorted 279418 Put Option Contracts, Suggesting They Have Turned To A Neutral Bias.
Nifty 50 Options Chain Analysis
The Nifty 50 options chain indicates that the highest open interest (OI) on the call side is at the 17,400 strike, followed by 17,500 strikes. On the put side, the highest OI is at the 17200 strike, followed by 17000 strikes. This suggests that the market participants are expecting Nifty 50 to remain range between 17200-17500 levels.
In the cash segment, Foreign Institutional Investors (FII) bought 357 crores, while Domestic Institutional Investors (DII) bought 2479 crores.
Traders who follow the musical octave trading path may find valuable insights in predicting Nifty’s movements. According to this path, Nifty may follow a path of 16825-17326-17826. This means that traders can take a position and potentially ride the move as Nifty moves through these levels.
Of course, it’s important to keep in mind that trading is inherently risky and market movements can be unpredictable. Low made was 16828 now heading towards 17326

After a Trading Loss Whatever the cause, the best solution is just to move on to the next trade with a clear mind and in good spirits.
For Positional Traders, The Nifty Futures’ Trend Change Level is At 17258 . Going Long Or Short Above Or Below This Level Can Help Them Stay On The Same Side As Institutions, With A Higher Risk-reward Ratio. Intraday Traders Can Keep An Eye On 17383 , Which Acts As An Intraday Trend Change Level.