


HDFC

HDFC forming a small descending triangle formation and breakout should come soon.
Buy above 854 Tgt 860,864 and 869 SL 852
Sell below 845 Tgt 842,837 and 830 SL 847
Reliance
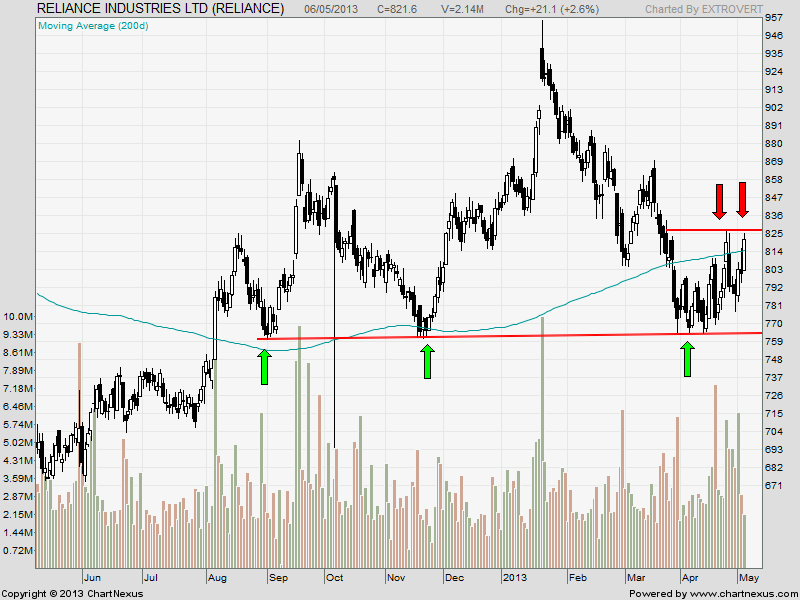
RIL is approching the higher end of its trading range with a close above both 50/200 SMA sugeesting range breakout on cards.
Buy above 825 Tgt 830,834 and 839 SL 822
Sell below 821 Tgt 817,813 and 808 SL 822
KTK Bank
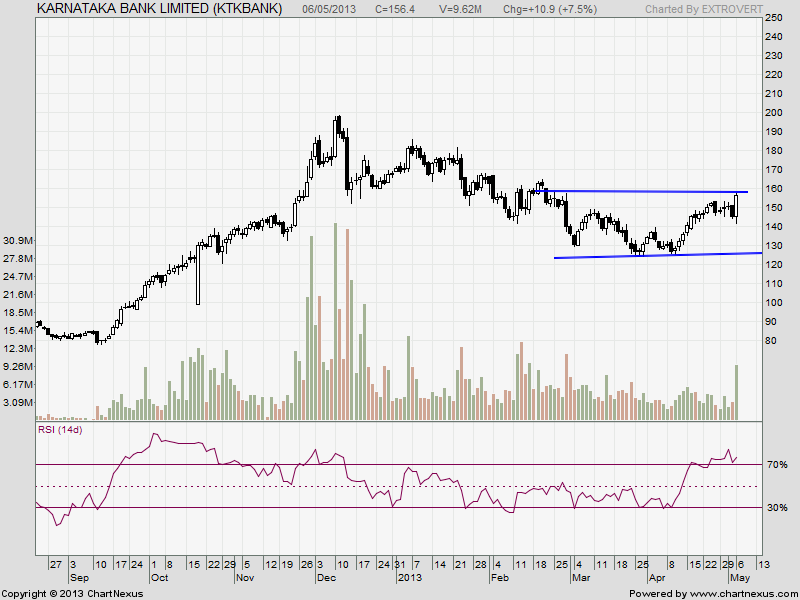 KTK rose with high volumes in last 45 minutes of trade, Stock has approached the higher end of trading range. Closing above it can see a breakout from short term prepective.
BUy above 158 Tgt 161,163.5 and 167 SL 156.3
Sell below 155 Tgt 152,150 and 147 SL 156.3
For the reference of readers the performance sheet for the Month of April/March Expiry has been updated, can be accessed from http://tradingsystemperformance.blogspot.in/.
- All prices relate to the NSE Spot
- Calls are based on the previous trading day’s price activity.
- The call is valid for the next trading session only unless otherwise mentioned.
- Stop-loss levels are given so that there is a level below/above, which the market will tell us that the call has gone wrong. Stop-loss is an essential risk control mechanism; it should always be there.
- Book, at least, part profits when the prices reach their targets; if you continue to hold on to positions then use trailing stops to lock in your profits.
We do discussion is Live market to update Nifty levels If you are interested you can LIKE the page to get Real Time Updates.
Follow on Facebook during Market Hours: http://www.facebook.com/pages/Brameshs-Tech/140117182685863