


HUL
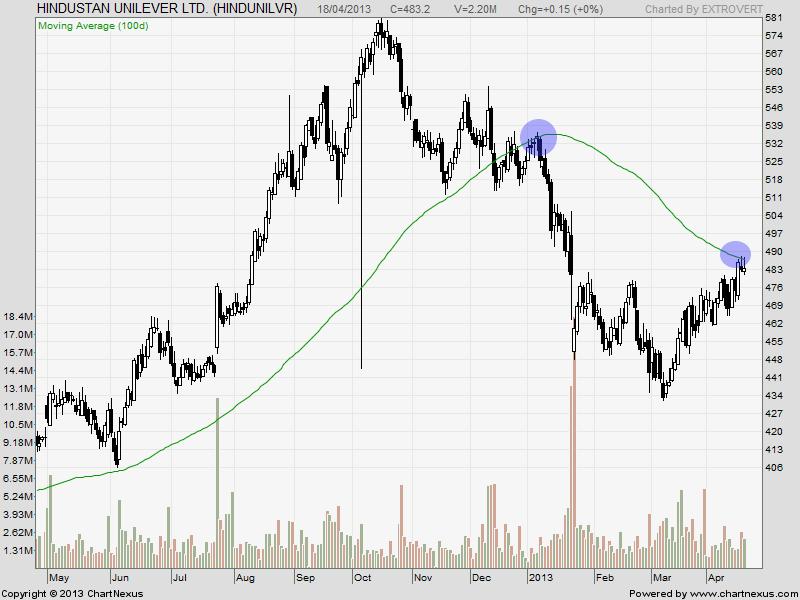
HUL is trading near a crucial resistance of 100 DMA, which stock is unable to cross from past 3.5 months, Unable to cross this time pullback can be seen in extremely short term.
Buy above 491 Tgt 493,496 and 505 SL 486
Sell below 482 Tgt 480,477 and 474 SL 484
Asian Paints
 Asain Paints has formed multiple resistance in range of 4718-4705 range and gave correction below it. Stock has closed below its 50 DMA giving bearish signal in extremely short term
Buy above4660 Tgt 4690,4718 and 4740 SL 4650
Sell below 4640 Tgt 4600,4550 and 4504 SL 4650
Ranbaxy

Ranbaxy is forming pennant formation raising prospect of explosive move in the coming week.
Buy above 459 Tgt 461,466 and 474 SL 456
Sell below 453 Tgt 449,445 and 440 SL 456
For the reference of readers the performance sheet for the Month of April/March Expiry has been updated, can be accessed from http://tradingsystemperformance.blogspot.in/ .
- All prices relate to the NSE Spot
- Calls are based on the previous trading day’s price activity.
- The call is valid for the next trading session only unless otherwise mentioned.
- Stop-loss levels are given so that there is a level below/above, which the market will tell us that the call has gone wrong. Stop-loss is an essential risk control mechanism; it should always be there.
- Book, at least, part profits when the prices reach their targets; if you continue to hold on to positions then use trailing stops to lock in your profits.
We do discussion is Live market to update Nifty levels If you are interested you can LIKE the page to get Real Time Updates.
Follow on Facebook during Market Hours: http://www.facebook.com/pages/Brameshs-Tech/140117182685863Gmail has encountered an error. Refresh the page and try again.