


Analysis of FIIs’ behavior in the Nifty Index Futures market shows a Bullish approach as they displayed a preference for LONG positions. On a net basis, FIIs went LONG 11670 contracts worth 1290 crores, resulting in an increase of 490 contracts in the Net Open Interest.
We have seen impact of Bayers Rule No 2 with a sharp pullack but bulls were able to protect 22048 on closing basis and tommrow we have “RULE NO. 38 MERCURY LATITUDE HELIOCENTRIC Some mighty fine tops and bottoms are produced when Mercury in this motion passes the above mentioned degrees” and Venus conjunct Mars important aspect for short term trading. Intraday traders should watch for first 15 mins high and low to take trade, Mars is plannet of energy to it will lead to voalitle and fast swing tommrow.
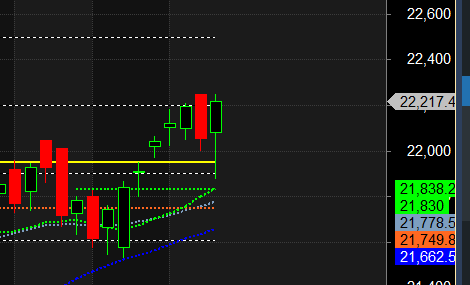
Mars did its work we saw a big volatile move as discussed. Nifty formed a new all time high , Today Mercury is changing Sign and we have FULL MOON on weekend so another volatile move will be seen, Market sign change genreally leads to trend change so bears need to break 21950 and Bulls need a move above 22319.

Nifty Trade Plan for Positional Trade ,Bulls will get active above 22319 for a move towards 22392/22466 . Bears will get active below 22171 for a move towards 22097/22023.
Traders may watch out for potential intraday reversals at 10:35,11:19,12:24,1:11,02:15 How to Find and Trade Intraday Reversal Times
Nifty Feb Futures Open Interest Volume stood at 1.11 lakh cr , witnessing a liquidation of 0.66 Lakh contracts. Additionally, the increase in Cost of Carry implies that there was a closeure of SHORT positions today.
Nifty Advance Decline Ratio at 24:26 and Nifty Rollover Cost is @21592 closed above it.
Nifty Gann Monthly Buy Trade level : 21915 and Gann Monthly Sell Trade level : 21646
Nifty has closed above 20/50/100/200 SMA.Trend is buy on dips till holding 22045. Break of 21952 Bears will be back
Nifty options chain shows that the maximum pain point is at 22300 and the put-call ratio (PCR) is at 1.05. Typically, when the PCR open interest ranges between 0.90 and 1.05, the market tends to remain range-bound.
Nifty 50 Options Chain Analysis
The Nifty 50 options chain indicates that the highest open interest (OI) on the call side is at the 22300 strike, followed by 22400 strikes. On the put side, the highest OI is at the 22100 strike, followed by 22000 strikes. This suggests that the market participants are expecting Nifty 50 to remain range between 21900-22200 levels.
In the cash segment, Foreign Institutional Investors (FII) sold 1410 crores, while Domestic Institutional Investors (DII) bought 1823 crores.
Traders who follow the musical octave trading path may find valuable insights in predicting Nifty’s movements. According to this path, Nifty may follow a path of 22467-21836-21205 This means that traders can take a position and potentially ride the move as Nifty moves through these levels.Of course, it’s important to keep in mind that trading is inherently risky and market movements can be unpredictable.

You’ve told yourself that you need to follow your rules, that you need to trade smaller, or that you should avoid trading during certain market conditions or times of day. Still you make the same mistakes, lose money, and build frustration., your attempts at change fail because they lack emotional force.
For Positional Traders, The Nifty Futures’ Trend Change Level is At 21900. Going Long Or Short Above Or Below This Level Can Help Them Stay On The Same Side As Institutions, With A Higher Risk-reward Ratio. Intraday Traders Can Keep An Eye On 22100, Which Acts As An Intraday Trend Change Level.
Nifty Intraday Trading Levels
Buy Above 22300 Tgt 22323, 22366 and 22399 ( Nifty Spot Levels)
Sell Below 22222 Tgt 22190, 22144 and 22108 (Nifty Spot Levels)
Wishing you good health and trading success as always.As always, prioritize your health and trade with caution.
As always, it’s essential to closely monitor market movements and make informed decisions based on a well-thought-out trading plan and risk management strategy. Market conditions can change rapidly, and it’s crucial to be adaptable and cautious in your approach.